Wolfram Data Repository
Immediate Computable Access to Curated Contributed Data
Locations of sea anemones (marine predatory animals, often quite colourful), annotated with diameter marks
| In[1]:= | ![ResourceData[\!\(\*
TagBox["\"\<Sample Data: Sea Anemones\>\"",
#& ,
BoxID -> "ResourceTag-Sample Data: Sea Anemones-Input",
AutoDelete->True]\), "Data"]](https://www.wolframcloud.com/obj/resourcesystem/images/3b6/3b64d6ef-ff3c-4a34-8611-b643f4b90b0c/18f5d0c9279326cb.png) |
| Out[1]= | 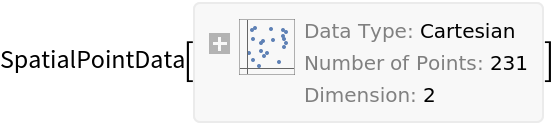 |
Summary of the spatial point data:
| In[2]:= | ![ResourceData[\!\(\*
TagBox["\"\<Sample Data: Sea Anemones\>\"",
#& ,
BoxID -> "ResourceTag-Sample Data: Sea Anemones-Input",
AutoDelete->True]\), "Data"]["Summary"]](https://www.wolframcloud.com/obj/resourcesystem/images/3b6/3b64d6ef-ff3c-4a34-8611-b643f4b90b0c/5892b4a3849908c9.png) |
| Out[2]= | 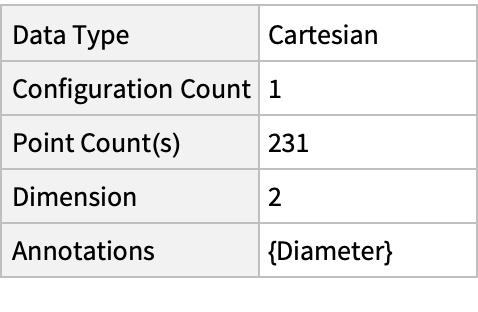 |
Plot the spatial point data:
| In[3]:= | ![ListPlot[ResourceData[\!\(\*
TagBox["\"\<Sample Data: Sea Anemones\>\"",
#& ,
BoxID -> "ResourceTag-Sample Data: Sea Anemones-Input",
AutoDelete->True]\), "Data"]]](https://www.wolframcloud.com/obj/resourcesystem/images/3b6/3b64d6ef-ff3c-4a34-8611-b643f4b90b0c/006c78aac09e7223.png) |
| Out[3]= | 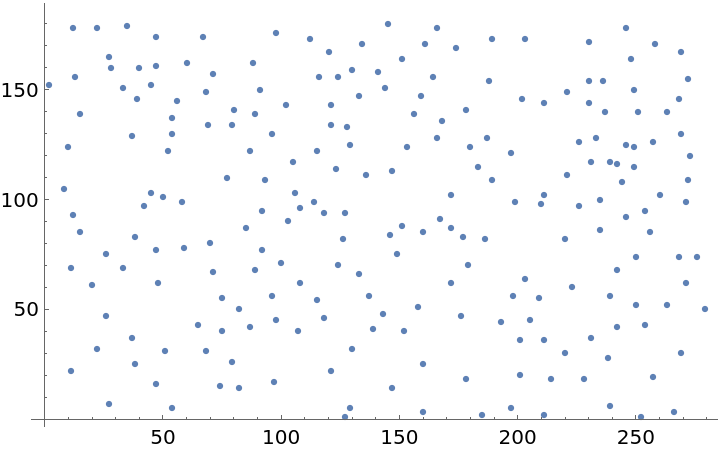 |
Visualize the points with annotations:
| In[4]:= | ![PointValuePlot[ResourceData[\!\(\*
TagBox["\"\<Sample Data: Sea Anemones\>\"",
#& ,
BoxID -> "ResourceTag-Sample Data: Sea Anemones-Input",
AutoDelete->True]\), "Data"], {1 -> "Size"}]](https://www.wolframcloud.com/obj/resourcesystem/images/3b6/3b64d6ef-ff3c-4a34-8611-b643f4b90b0c/2c36401a5d4cf741.png) |
| Out[4]= | 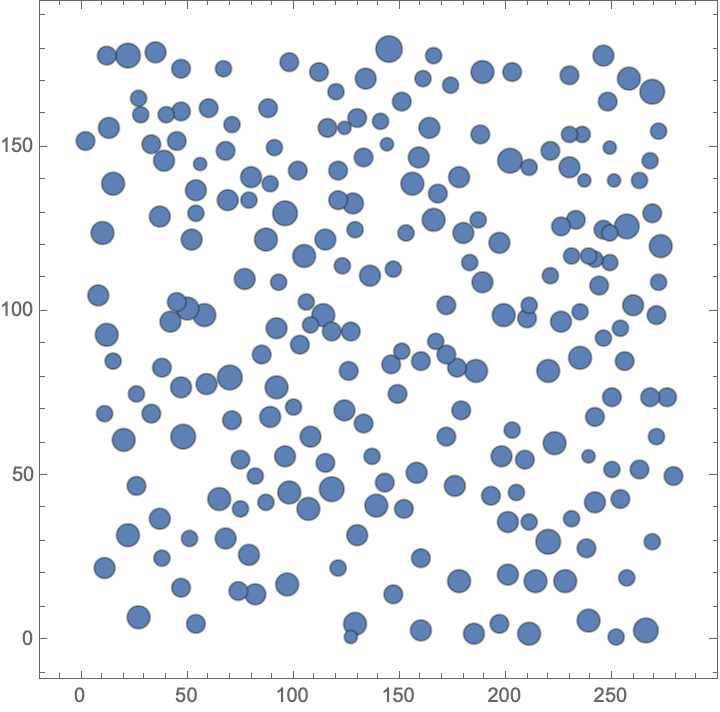 |
Visualize the smooth point density:
| In[5]:= | ![density = SmoothPointDensity[ResourceData[\!\(\*
TagBox["\"\<Sample Data: Sea Anemones\>\"",
#& ,
BoxID -> "ResourceTag-Sample Data: Sea Anemones-Input",
AutoDelete->True]\), "Data"]]](https://www.wolframcloud.com/obj/resourcesystem/images/3b6/3b64d6ef-ff3c-4a34-8611-b643f4b90b0c/405c35b96e895587.png) |
| Out[5]= |  |
| In[6]:= | ![Show[ContourPlot[density[{x, y}], {x, y} \[Element] ResourceData[\!\(\*
TagBox["\"\<Sample Data: Sea Anemones\>\"",
#& ,
BoxID -> "ResourceTag-Sample Data: Sea Anemones-Input",
AutoDelete->True]\), "ObservationRegion"], ColorFunction -> "Rainbow"], ListPlot[ResourceData[\!\(\*
TagBox["\"\<Sample Data: Sea Anemones\>\"",
#& ,
BoxID -> "ResourceTag-Sample Data: Sea Anemones-Input",
AutoDelete->True]\), "Data"], PlotStyle -> Black]]](https://www.wolframcloud.com/obj/resourcesystem/images/3b6/3b64d6ef-ff3c-4a34-8611-b643f4b90b0c/593fa57fb376cc91.png) |
| Out[6]= | 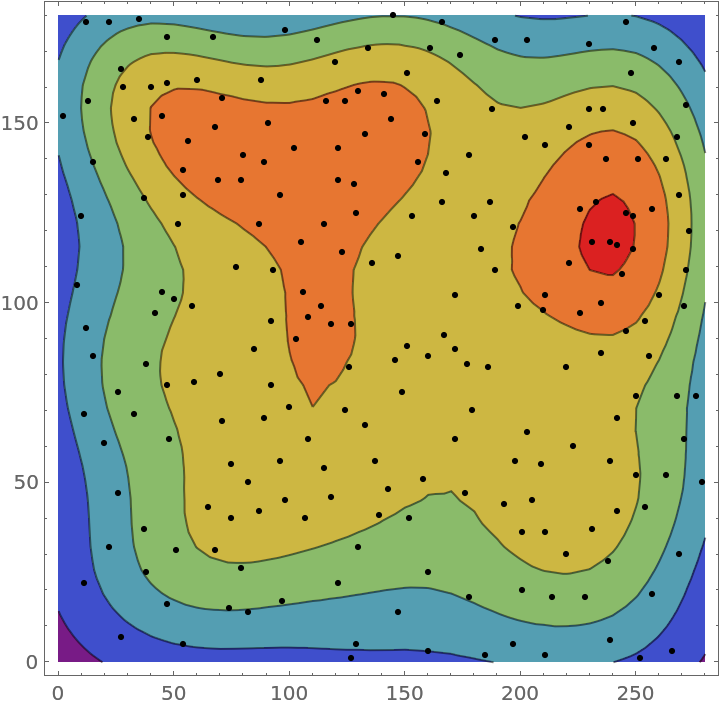 |
Compute probability of finding a point within given radius of an existing point - NearestNeighborG is the CDF of the nearest neighbor distribution:
| In[7]:= | ![nnG = NearestNeighborG[ResourceData[\!\(\*
TagBox["\"\<Sample Data: Sea Anemones\>\"",
#& ,
BoxID -> "ResourceTag-Sample Data: Sea Anemones-Input",
AutoDelete->True]\), "Data"]]](https://www.wolframcloud.com/obj/resourcesystem/images/3b6/3b64d6ef-ff3c-4a34-8611-b643f4b90b0c/0ab1ec2a847de8b7.png) |
| Out[7]= |  |
| In[8]:= | ![maxR = nnG["MaxRadius"]](https://www.wolframcloud.com/obj/resourcesystem/images/3b6/3b64d6ef-ff3c-4a34-8611-b643f4b90b0c/3ac529770b58056a.png) |
| Out[8]= |  |
| In[9]:= | ![DiscretePlot[nnG[r], {r, maxR/100, maxR, maxR/100}, AxesLabel -> {"radius", "probability"}]](https://www.wolframcloud.com/obj/resourcesystem/images/3b6/3b64d6ef-ff3c-4a34-8611-b643f4b90b0c/26ffcbb575f8b882.png) |
| Out[9]= | 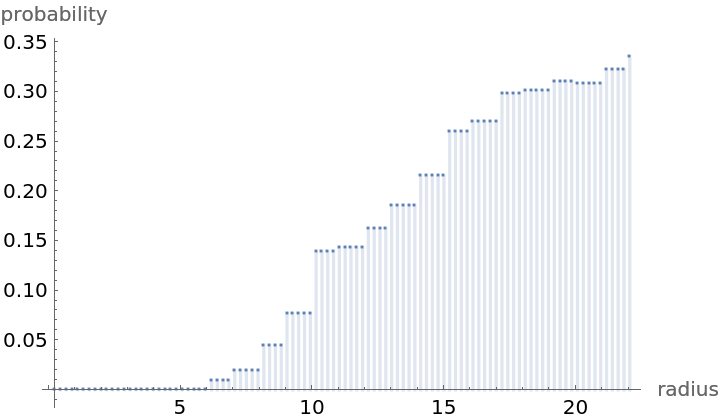 |
NearestNeighborG as the CDF of nearest neighbor distribution can be used to compute the mean distance between a typical point and its nearest neighbor - the mean of a positive support distribution can be approximated via a Riemann sum of 1- CDF. To use Riemann approximation create the partition of the support interval from 0 to maxR into 100 parts and compute the value of the NearestNeighborG at the middle of each subinterval:
| In[10]:= | ![step = maxR/100;
middles = Subdivide[step/2, maxR - step/2, 99];
values = nnG[middles];](https://www.wolframcloud.com/obj/resourcesystem/images/3b6/3b64d6ef-ff3c-4a34-8611-b643f4b90b0c/5938887fcf2f96cf.png) |
Now compute the Riemann sum to find the mean distance between a typical point and its nearest neighbor:
| In[11]:= | ![Total[(1 - values)*step]](https://www.wolframcloud.com/obj/resourcesystem/images/3b6/3b64d6ef-ff3c-4a34-8611-b643f4b90b0c/4743014b98111987.png) |
| Out[11]= |  |
Test for complete spacial randomness:
| In[12]:= | ![SpatialRandomnessTest[ResourceData[\!\(\*
TagBox["\"\<Sample Data: Sea Anemones\>\"",
#& ,
BoxID -> "ResourceTag-Sample Data: Sea Anemones-Input",
AutoDelete->True]\), "Data"], {"PValue", "TestConclusion"}] // Column](https://www.wolframcloud.com/obj/resourcesystem/images/3b6/3b64d6ef-ff3c-4a34-8611-b643f4b90b0c/5a355e5e8e65f6db.png) |
| Out[12]= |  |
Fit a Poisson point process to data:
| In[13]:= | ![Clear[\[Mu]];
EstimatedPointProcess[ResourceData[\!\(\*
TagBox["\"\<Sample Data: Sea Anemones\>\"",
#& ,
BoxID -> "ResourceTag-Sample Data: Sea Anemones-Input",
AutoDelete->True]\), "Data"], PoissonPointProcess[\[Mu], 2]]](https://www.wolframcloud.com/obj/resourcesystem/images/3b6/3b64d6ef-ff3c-4a34-8611-b643f4b90b0c/2b6c8f6de2e4e2f9.png) |
| Out[14]= |  |
Gosia Konwerska, "Sample Data: Sea Anemones" from the Wolfram Data Repository (2022)