Wolfram Data Repository
Immediate Computable Access to Curated Contributed Data
Monthly averages of hourly readings of ozone in downtown Los Angeles with values in pphm
| In[1]:= |
| Out[1]= | 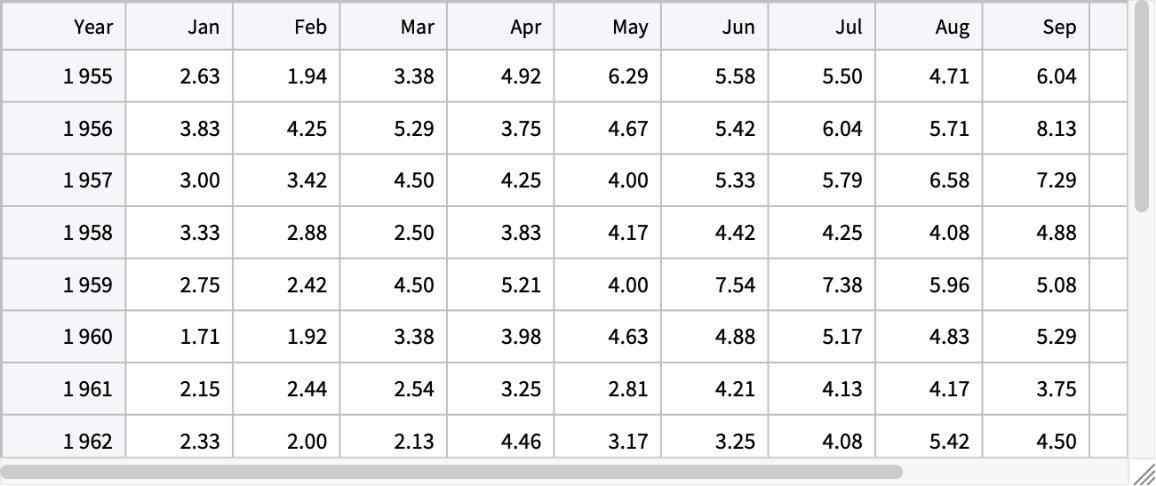 |
Column keys and types:
| In[2]:= |
| Out[2]= |
| In[3]:= |
| Out[3]= |
Compute the mean for each column - each month:
| In[4]:= | ![rules = Map[With[{name = #}, name -> Function[Mean[#[name]]]] &, Rest[ResourceData[\!\(\*
TagBox["\"\<Sample Tabular Data: Los Angeles Ozone\>\"",
#& ,
BoxID -> "ResourceTag-Sample Tabular Data: Los Angeles Ozone-Input",
AutoDelete->True]\), "ColumnKeys"]]];](https://www.wolframcloud.com/obj/resourcesystem/images/06e/06efe311-36de-4810-8916-8576ce2f7fdc/21caeeba49d509c6.png) |
| In[5]:= |
| Out[5]= | 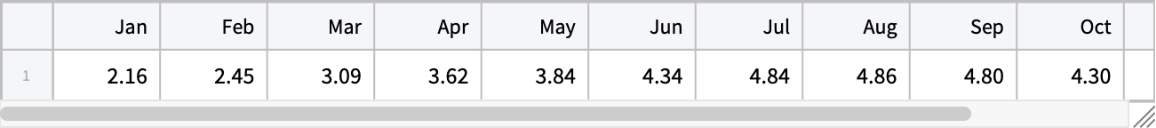 |
Visualize the mean seasonality:
| In[6]:= |
| Out[6]= | 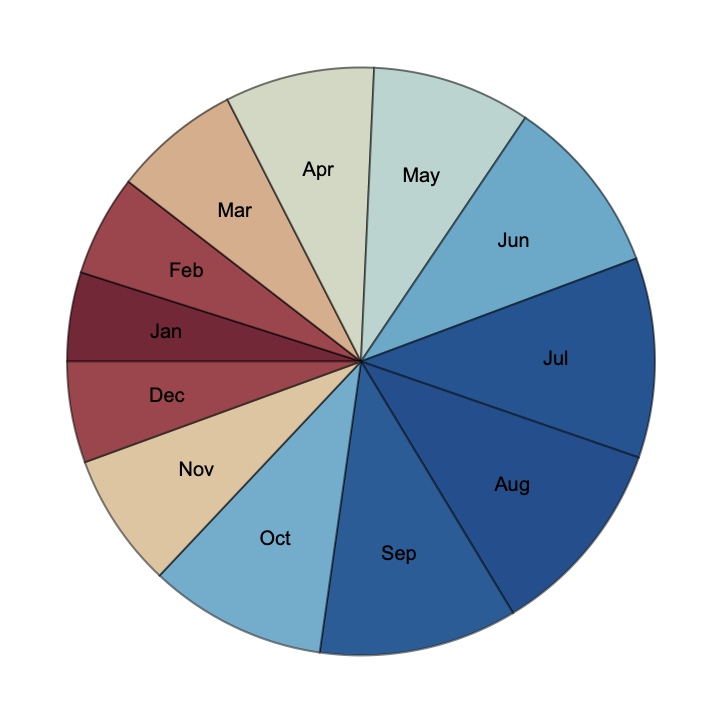 |
Compute basic descriptive statistics for each year (remove year column first):
| In[7]:= | ![ConstructColumns[ResourceData[\!\(\*
TagBox["\"\<Sample Tabular Data: Los Angeles Ozone\>\"",
#& ,
BoxID -> "ResourceTag-Sample Tabular Data: Los Angeles Ozone-Input",
AutoDelete->True]\)][[All, 2 ;;]], {"Mean" -> Mean, "Median" -> Median, "StandardDeviation" -> StandardDeviation, "IQR" -> InterquartileRange}]](https://www.wolframcloud.com/obj/resourcesystem/images/06e/06efe311-36de-4810-8916-8576ce2f7fdc/321c0fe0adfb6c89.png) |
| Out[7]= | 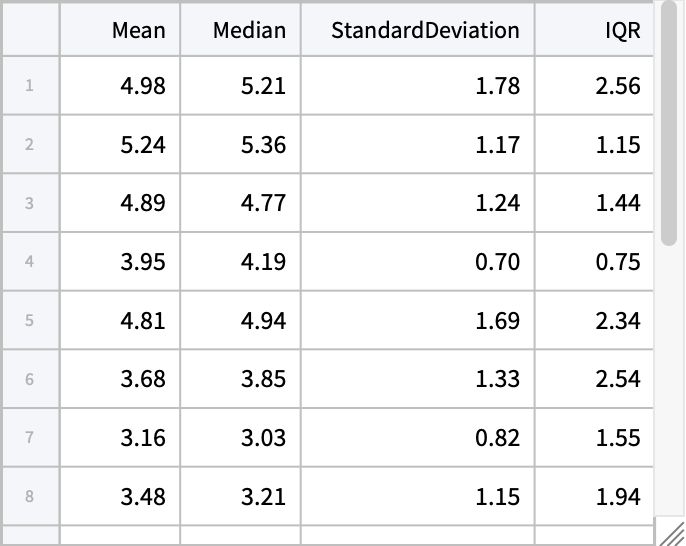 |
Reinsert back the year column:
| In[8]:= | ![stats = InsertColumns[%, {"Year" -> ResourceData[\!\(\*
TagBox["\"\<Sample Tabular Data: Los Angeles Ozone\>\"",
#& ,
BoxID -> "ResourceTag-Sample Tabular Data: Los Angeles Ozone-Input",
AutoDelete->True]\)][All, "Year"], "Mean"}]](https://www.wolframcloud.com/obj/resourcesystem/images/06e/06efe311-36de-4810-8916-8576ce2f7fdc/54c334c1b69af90a.png) |
| Out[8]= | 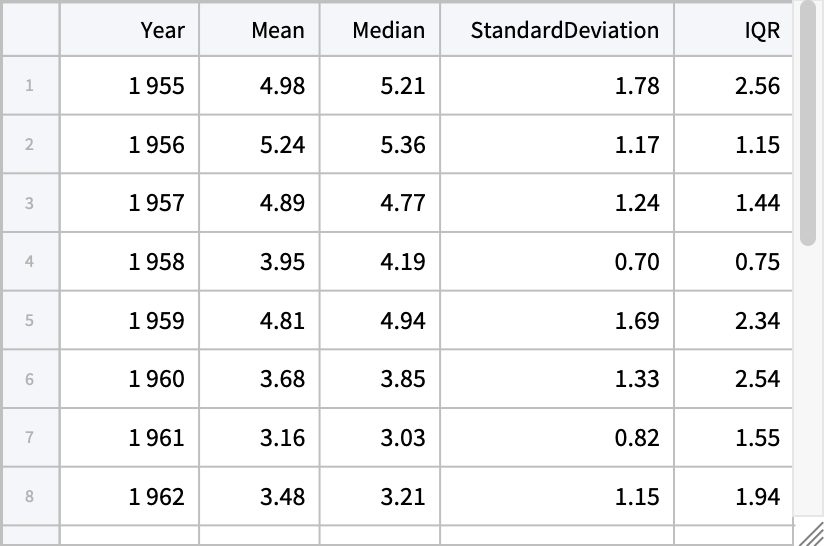 |
Plot the mean yearly series:
| In[9]:= |
| Out[9]= | 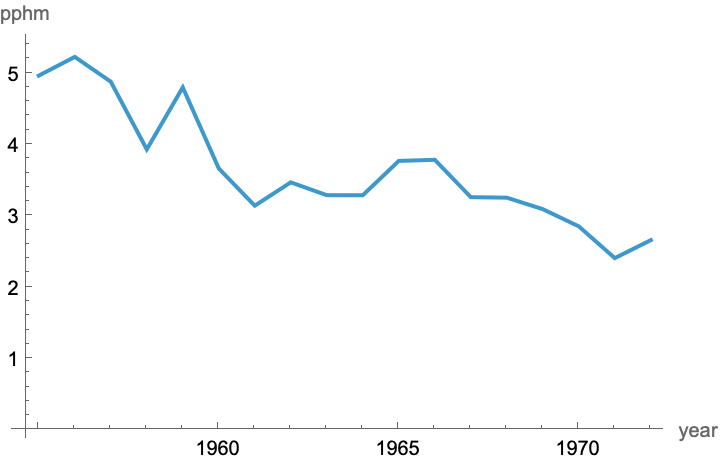 |
Create standard deviation bands for the mean:
| In[10]:= | ![bands = ConstructColumns[
stats, {"Year", "Mean", "Lower" -> Function[#Mean - #StandardDeviation], "Upper" -> Function[#Mean + #StandardDeviation]}]](https://www.wolframcloud.com/obj/resourcesystem/images/06e/06efe311-36de-4810-8916-8576ce2f7fdc/5cdae260e48540e3.png) |
| Out[10]= | 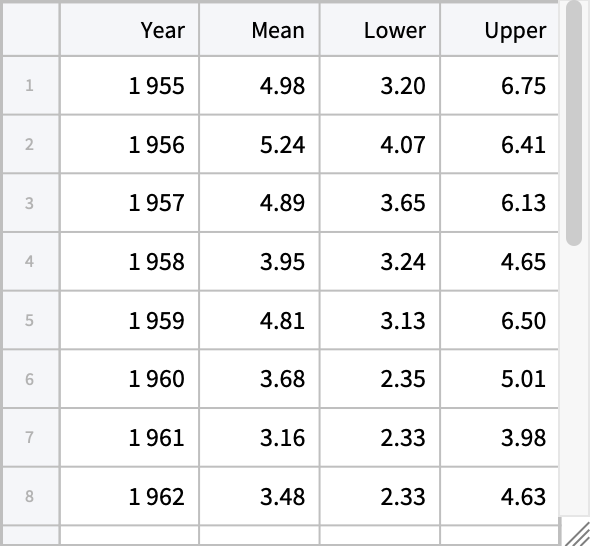 |
Visualize the mean with the bands:
| In[11]:= |
| Out[11]= |  |
Gosia Konwerska, "Sample Tabular Data: Los Angeles Ozone" from the Wolfram Data Repository (2024)