Wolfram Data Repository
Immediate Computable Access to Curated Contributed Data
Data on family income and costs of housing and transportion in U.S. cities
Originator: U.S. Department of Housing and Urban Development
The 8 household types defined by the source are differentiated by their income levels and family size. The income levels for these household types are classified as follows: A median-income family's income is at the median income level for the region. A very low-income individual's income is at the national povery line. A working individual's income is at 50% of the median income for the region. A single professional's income is at 135% of the median income for the region. A retired couple's income is at 80% of the median income for a region. A single-parent family's income is at 50% of the median income for the region. A moderate-income family's income is at 80% of the median income for the region. A dual-professional family's income is at 150% of the median income for the region. Please note that The HHType*IncomeMin and HHType*IncomeMax values only vary for data aggregated to geographies that intersect multiple regions. In all other cases these values will be the same as the income value.
(187 columns, 24010 rows)
View a sample of the data:
| In[1]:= |
| Out[1]= | 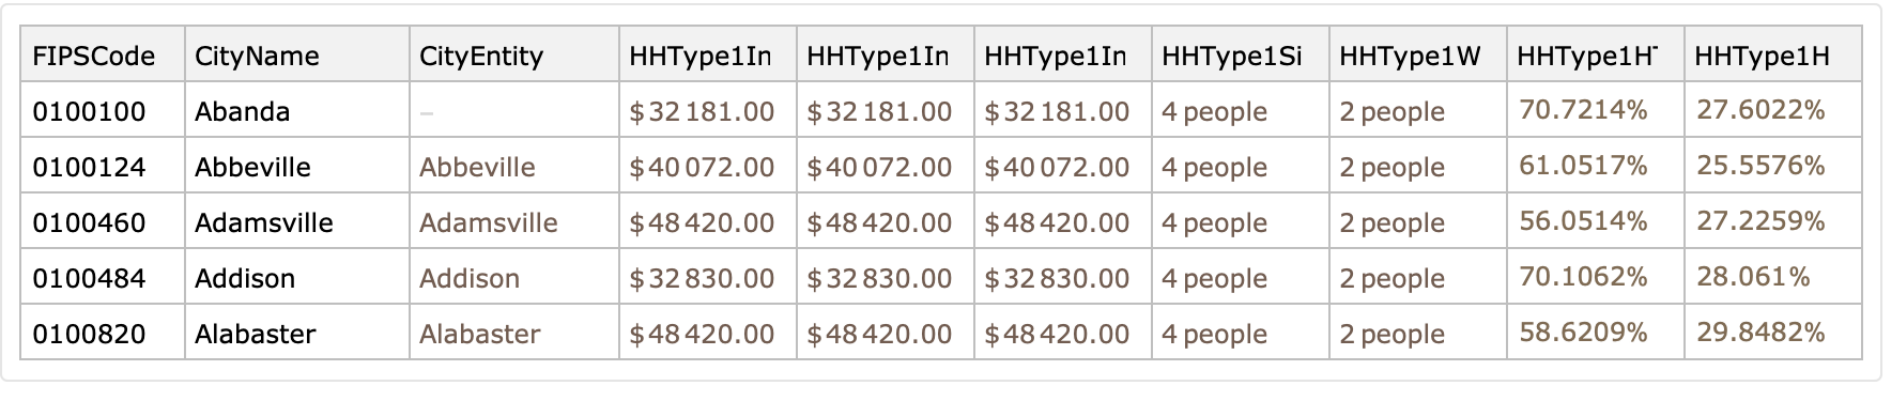 |
See the available properties:
| In[2]:= |
| Out[2]= |  |
Visualize transportation costs for different household types:
| In[3]:= | ![ListPlot[ResourceData["HUD Location Affordability Index"][
All, {"HHType2T", "HHType8T"}], PlotTheme -> "Detailed", PlotLabel -> "Transportation costs by US city", FrameLabel -> {"Very low-income individuals", "Dual-professional families"}]](https://www.wolframcloud.com/obj/resourcesystem/images/0e4/0e4fcfc5-0540-48c1-ad7e-08c5c8ce2fdd/782fa52d796085a0.png) |
| Out[3]= | 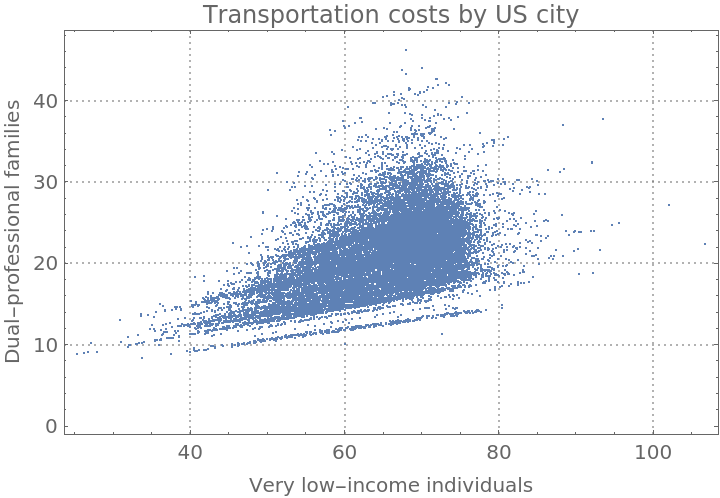 |
Wolfram Research, "HUD Location Affordability Index" from the Wolfram Data Repository (2016) https://doi.org/10.24097/wolfram.62266.data