Wolfram Data Repository
Immediate Computable Access to Curated Contributed Data
New York City rat sighting service requests, 2010-2016
Rat sighting service requests from 2010 to present
(11 columns, 86590 rows)
Retrieve the resource:
| In[1]:= |
| Out[1]= |  |
Retrieve the default content:
| In[2]:= |
| Out[2]= | 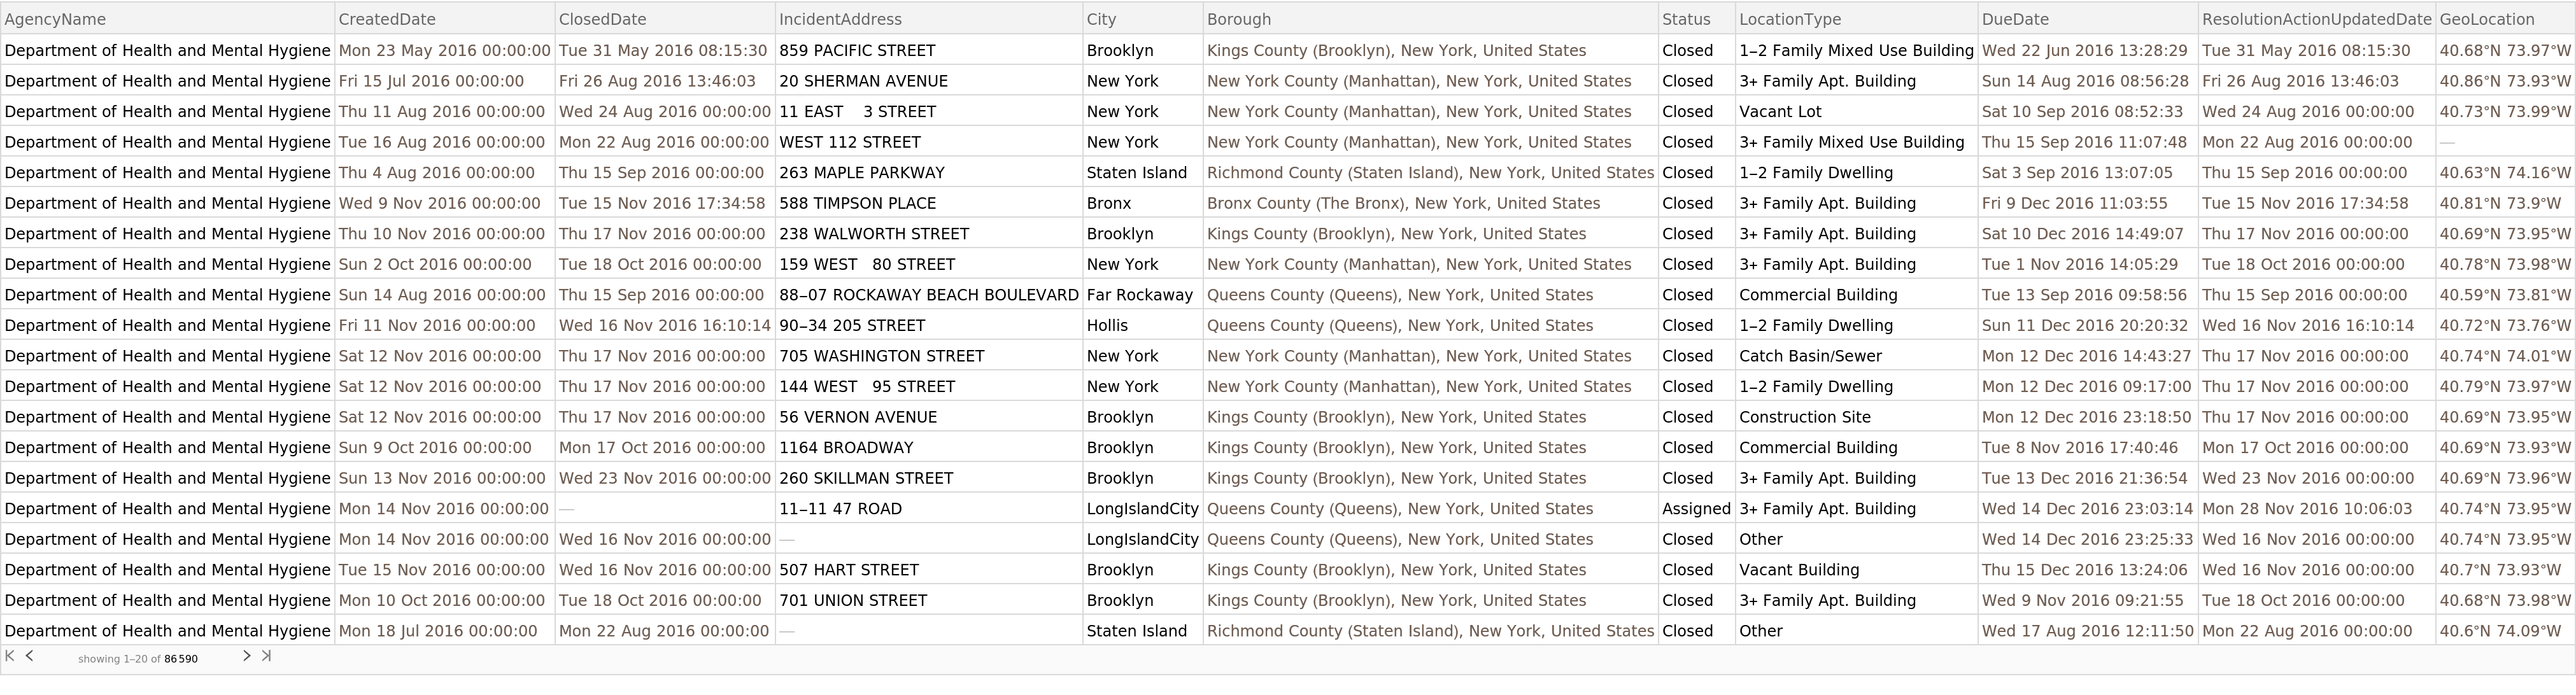 |
Generate a GeoHistogram of all sightings:
| In[3]:= |
| Out[3]= | 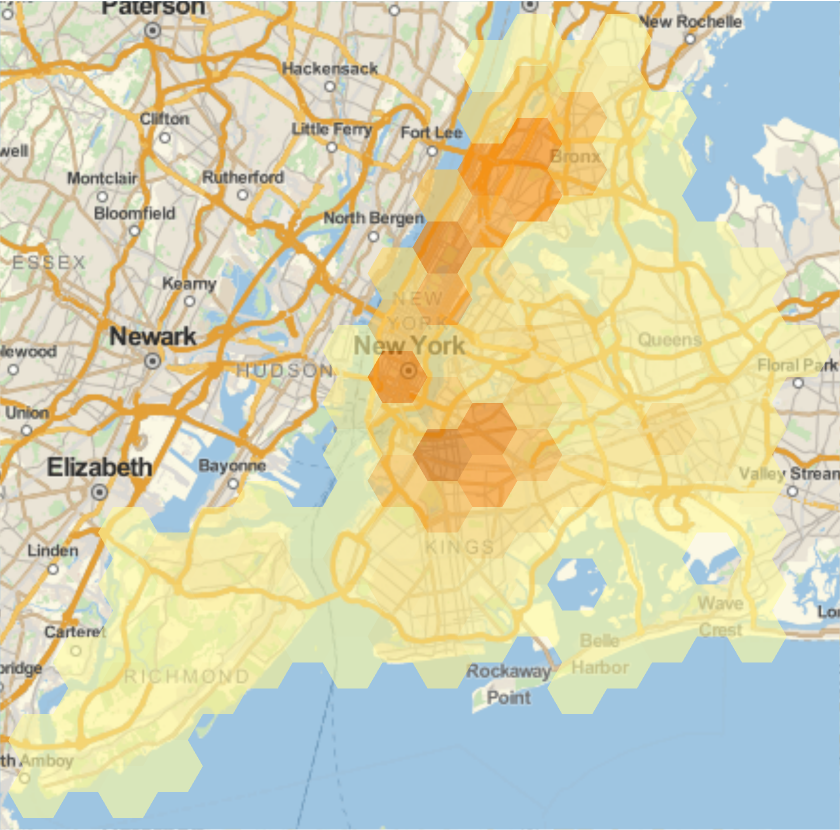 |
Chart total sightings by Borough:
| In[4]:= |
| Out[4]= |  |
Wolfram Research, "NYC Rat Sightings" from the Wolfram Data Repository (2017) https://doi.org/10.24097/wolfram.66999.data
https://data.cityofnewyork.us/Social-Services/311-Service-Requests-from-2010-to-Present/erm2-nwe9/data