Analysis (5)
Perform a linear regression on the data to see what effect job training may have had:
Examine the parameters and the adjusted R2. It appears that this form of the model does not have much predictive value. Not receiving job training lowered wages by $824, but one can not be certain that the result is statistically significant:
Perform a logistic regression to determine what factors affected whether one received "treatment" (i.e. was enrolled in the job training program):
The only statistically significant factor in determining treatment is the absence of a high school degree. The very low Cragg Uhler Pseudo R2 suggests that the model does not have much explanatory power:
See if a probit model performs any better; it does not:
Split the data into training and test set:
Run a classifier on the training set:
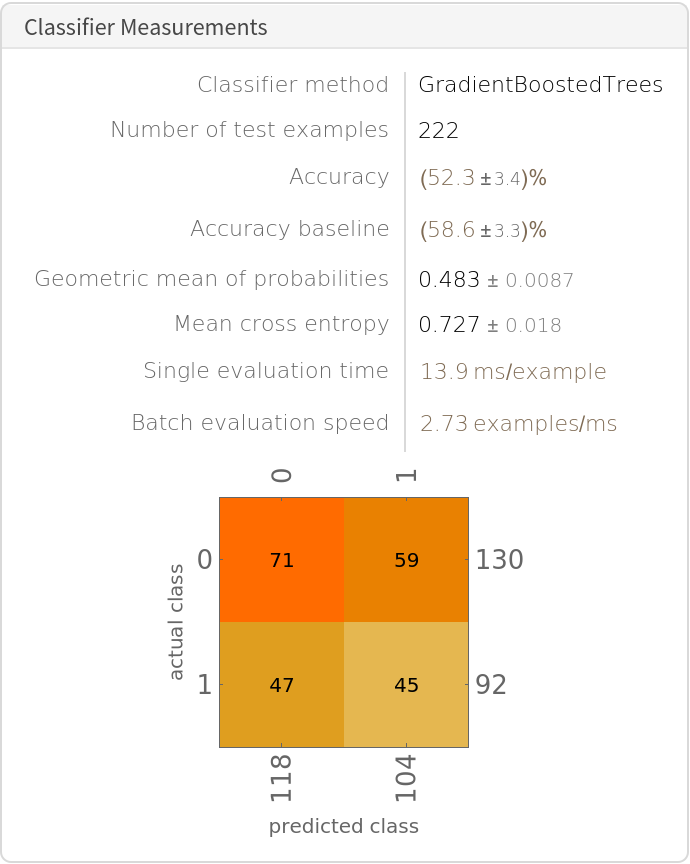
Create a classifier measurements object using the classifier just built and the test data:
Assess classifier performance. The machine learning classifier does not perform particularly well:
A look at the probabilities of being treated shows the classifier is extremely uncertain in its results; the range of probabilities is extremely small:
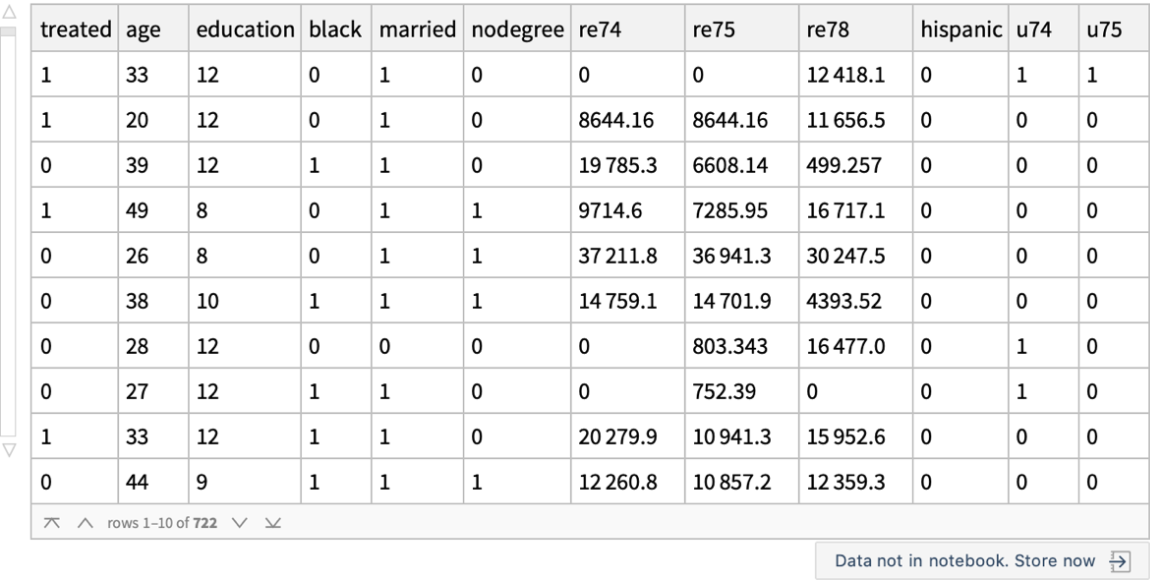
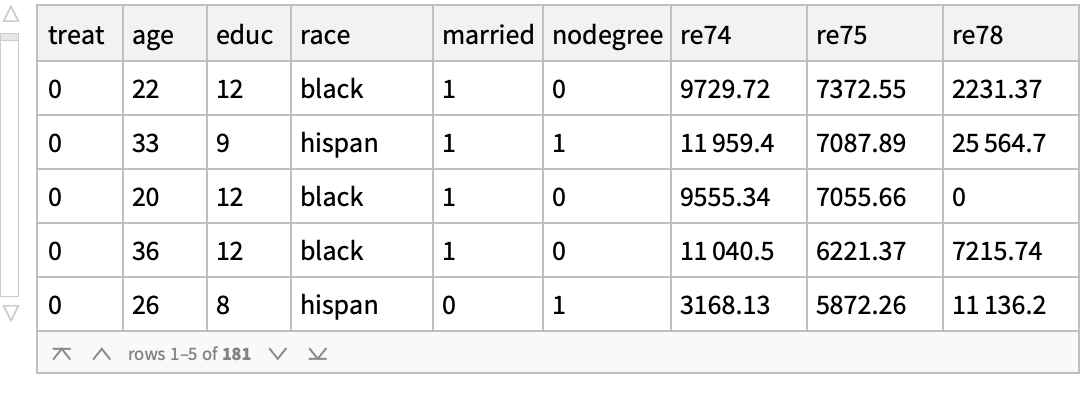
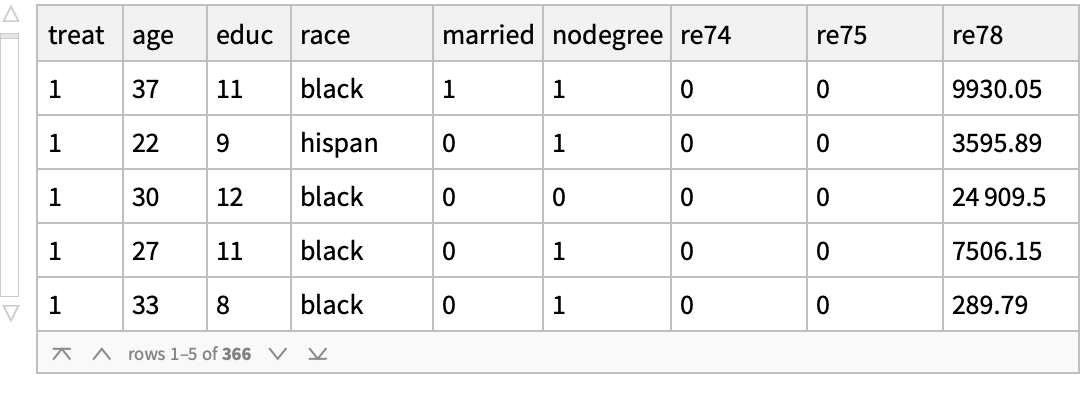
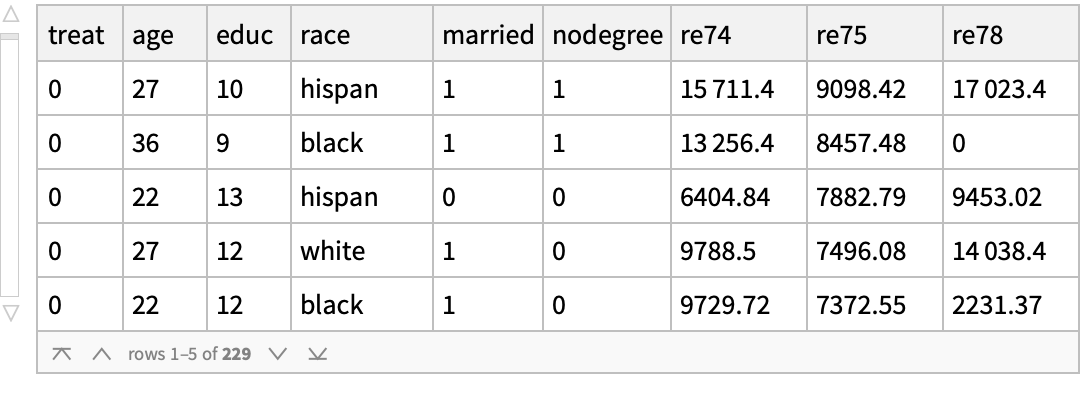
Use the "MatchIt Lalonde" data and compare the mean values of various covariates among the treated and untreated groups:
Generate an anomaly detector function of the covariates of the treated population:
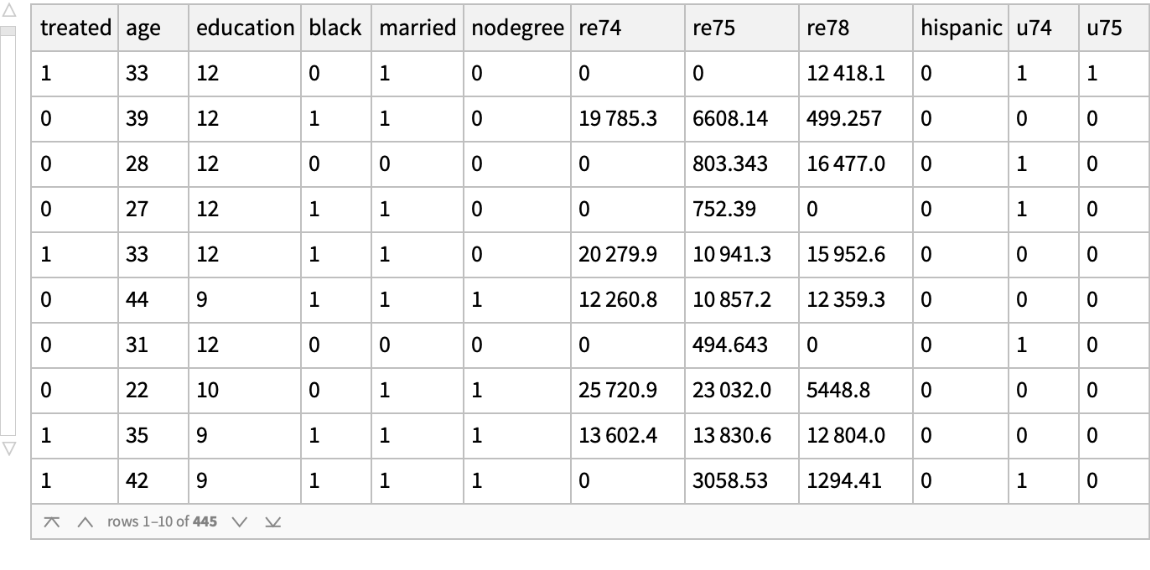
Use the anomaly detector function on the untreated (control) population but set the AcceptanceThreshold to be extremely high so that most members are treated as anomalous, which will bring the number of persons in the remaining untreated population down to about the number of persons in the treated population:
Join the treated persons with the non-anomalous members of the control group:
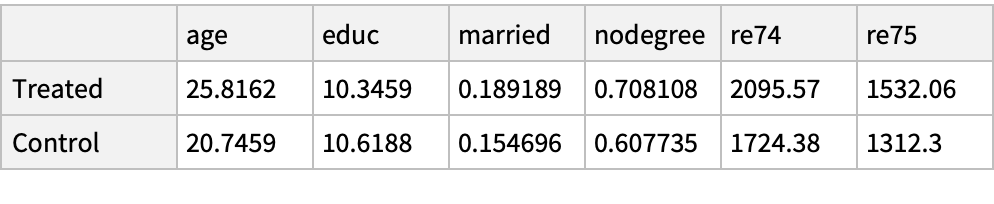
And now compare the mean values of their covariates, which are now considerably more similar to each other:
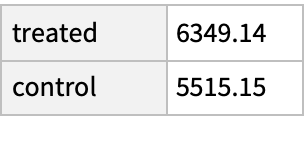
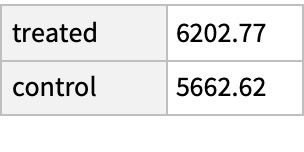
Compare the mean earnings in 1978 among the treated and untreated in the matched groups; the treated group has income about $800 higher even though their demographics are, on average, about the same:
The increase in median income is much smaller, suggesting that the increased income among the treated may come for a few high earners:
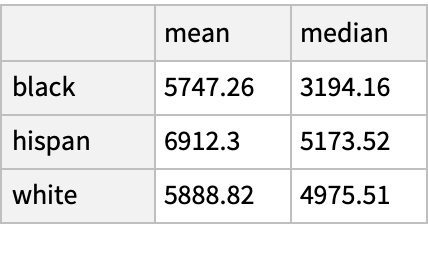
Compare the mean and median income in 1978 by race among the matched individuals:
The preceding example established what was "normal" by looking at the treatment data and then eliminated rows of the control data that looked anomalous by that standard. This use of the treatment data as the baseline is standard in the literature, but perhaps somewhat arbitrary. An alternative approach would be to take only treatment data that was "normal" by looking at the control data and taking only control data that was "normal" by looking at the treatment data. Such a method could use symmetric "acceptance thresholds." Compute an anomaly detection function on the control data:
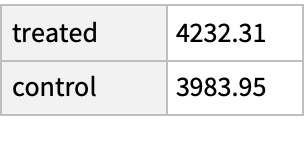
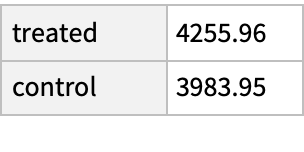
Use of this alternative matching method results in the average treatment effect being smaller than in the prior example:
The increase in median income caused by the treatment appears more robust against changes in the matching methodology:
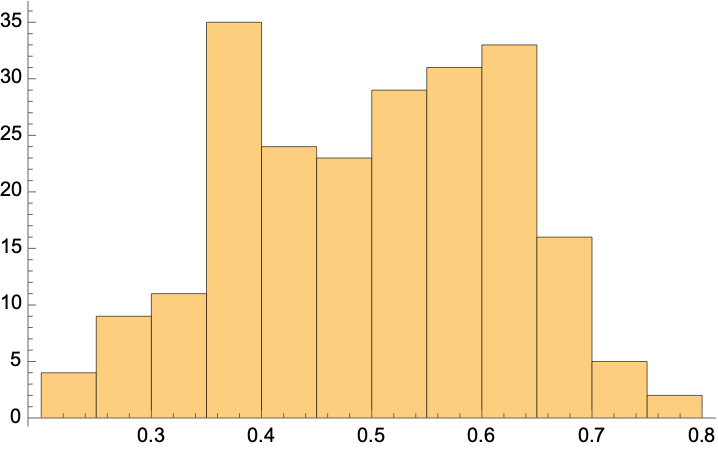
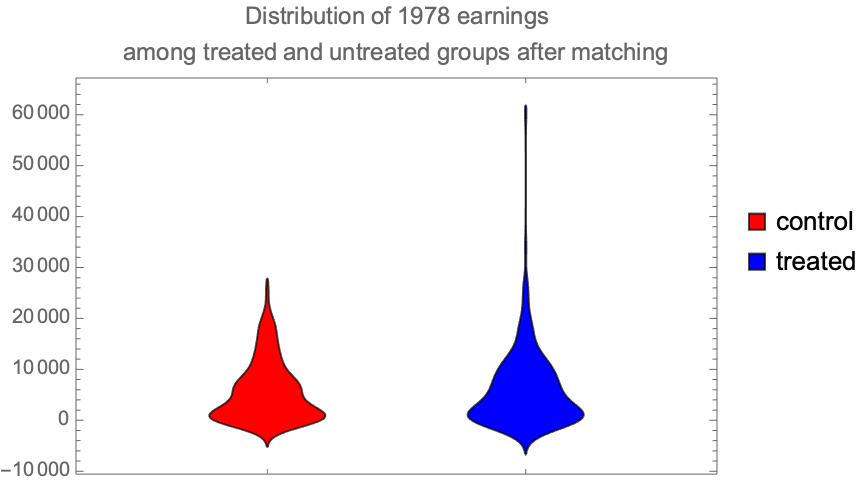
Make a distribution chart showing the difference in the distribution of incomes between those not receiving job training and those doing so. The chart suggests that the gains in earnings come for a few people in the treated group earning what were high amounts of money:
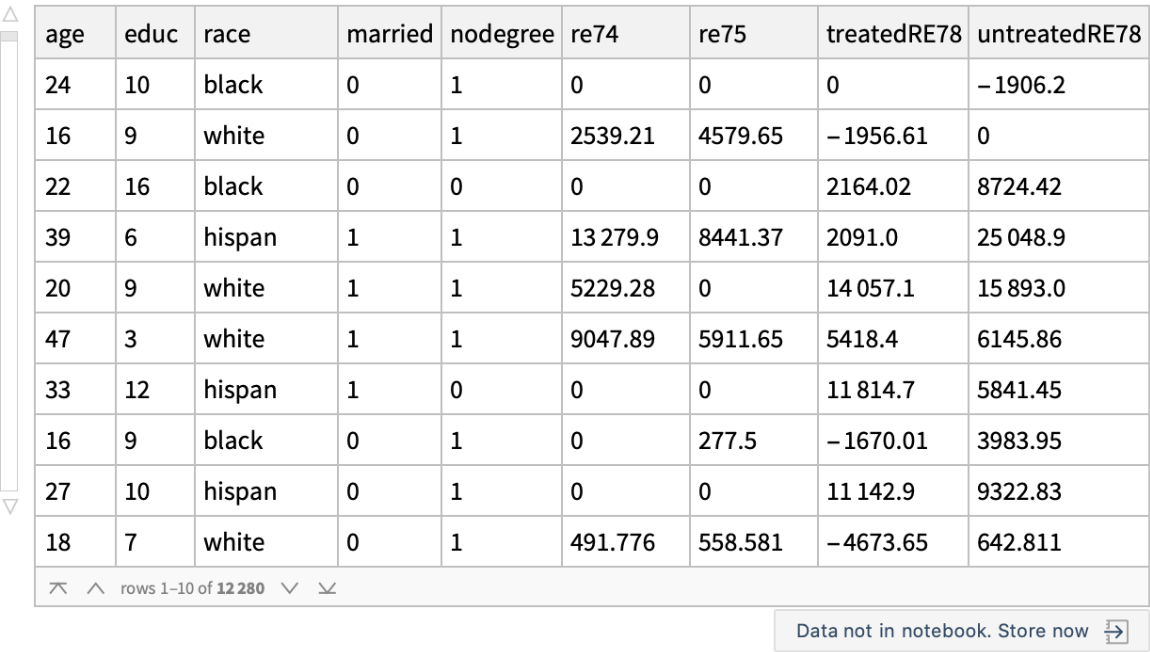
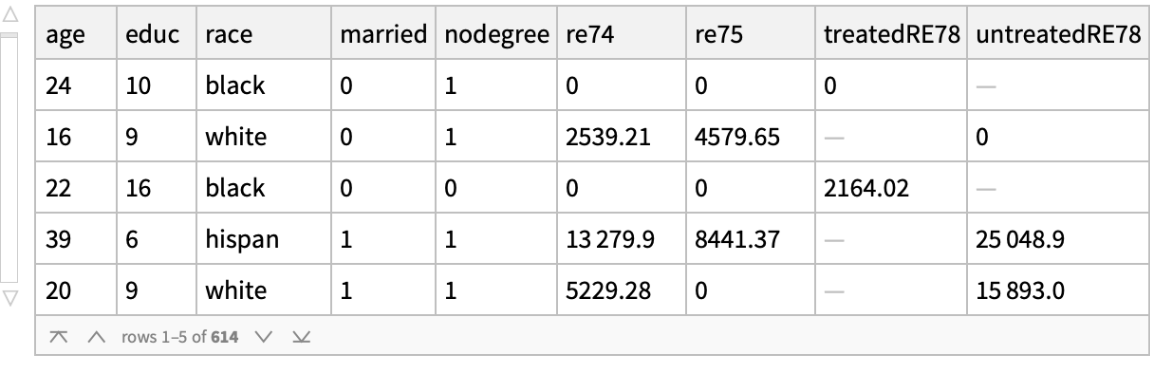
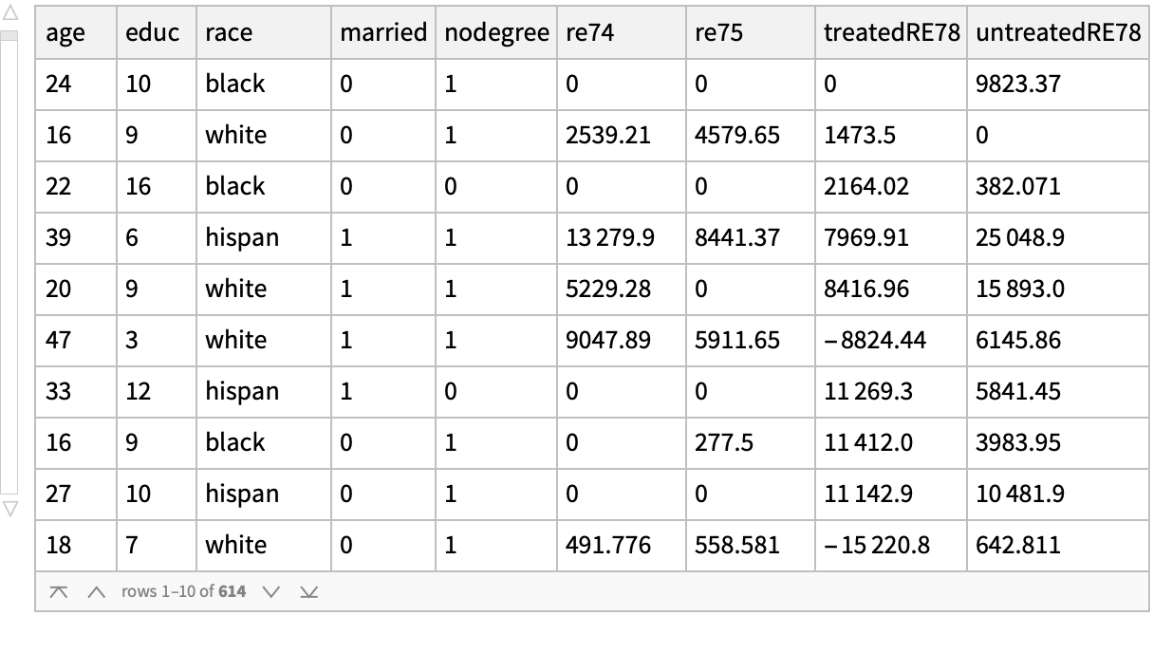
The "fundamental problem of causal inference" (https://en.wikipedia.org/wiki/Rubin_causal_model) is said to be that we can observe only the treated outcome or the untreated outcome on the individual, but not both. The problem is essentially one of missing data. But Wolfram Language can impute missing values, which, as described in these lecture notes and this journal article, suggests a direct approach to causal inference. First, create a new dataset with missings:
Then use SynthesizeMissingValues to "solve" the fundamental problem of causal inference:
Now find the mean earnings when the population is "treated" with job training and when it is not. This method suggests that job training causes a loss of earnings rather than the generally accepted notion that it results in a gain. This finding suggests that direct use of missing value imputation must be explored further before it is used as an accepted algorithm for making causal inferences:
We can see if using RandomSampling as the EvaluationStrategy instead of the default ModeFinding helps:
We fine that it does not solve the problem. So, missing value imputation, although theoretically promising as a vehicle for causal inference, has tricky and presently unresolved implementation issues:
![ResourceFunction[
ResourceObject[
Association[
"Name" -> "MapReduceOperator", "ShortName" -> "MapReduceOperator",
"UUID" -> "856f4937-9a4c-44a9-88ae-cfc2efd4698f", "ResourceType" -> "Function", "Version" -> "1.0.0", "Description" -> "Like an operator form of GroupBy, but where one also specifies a reducer function to be applied", "RepositoryLocation" -> URL[
"https://www.wolframcloud.com/obj/resourcesystem/api/1.0"], "SymbolName" -> "FunctionRepository`$ad7fe533436b4f8294edfa758a34ac26`MapReduceOperator", "FunctionLocation" -> CloudObject[
"https://www.wolframcloud.com/obj/6d981522-1eb3-4b54-84f6-55667fb2e236"]], ResourceSystemBase -> Automatic]][(Switch[{#black, #hispanic}, {1,
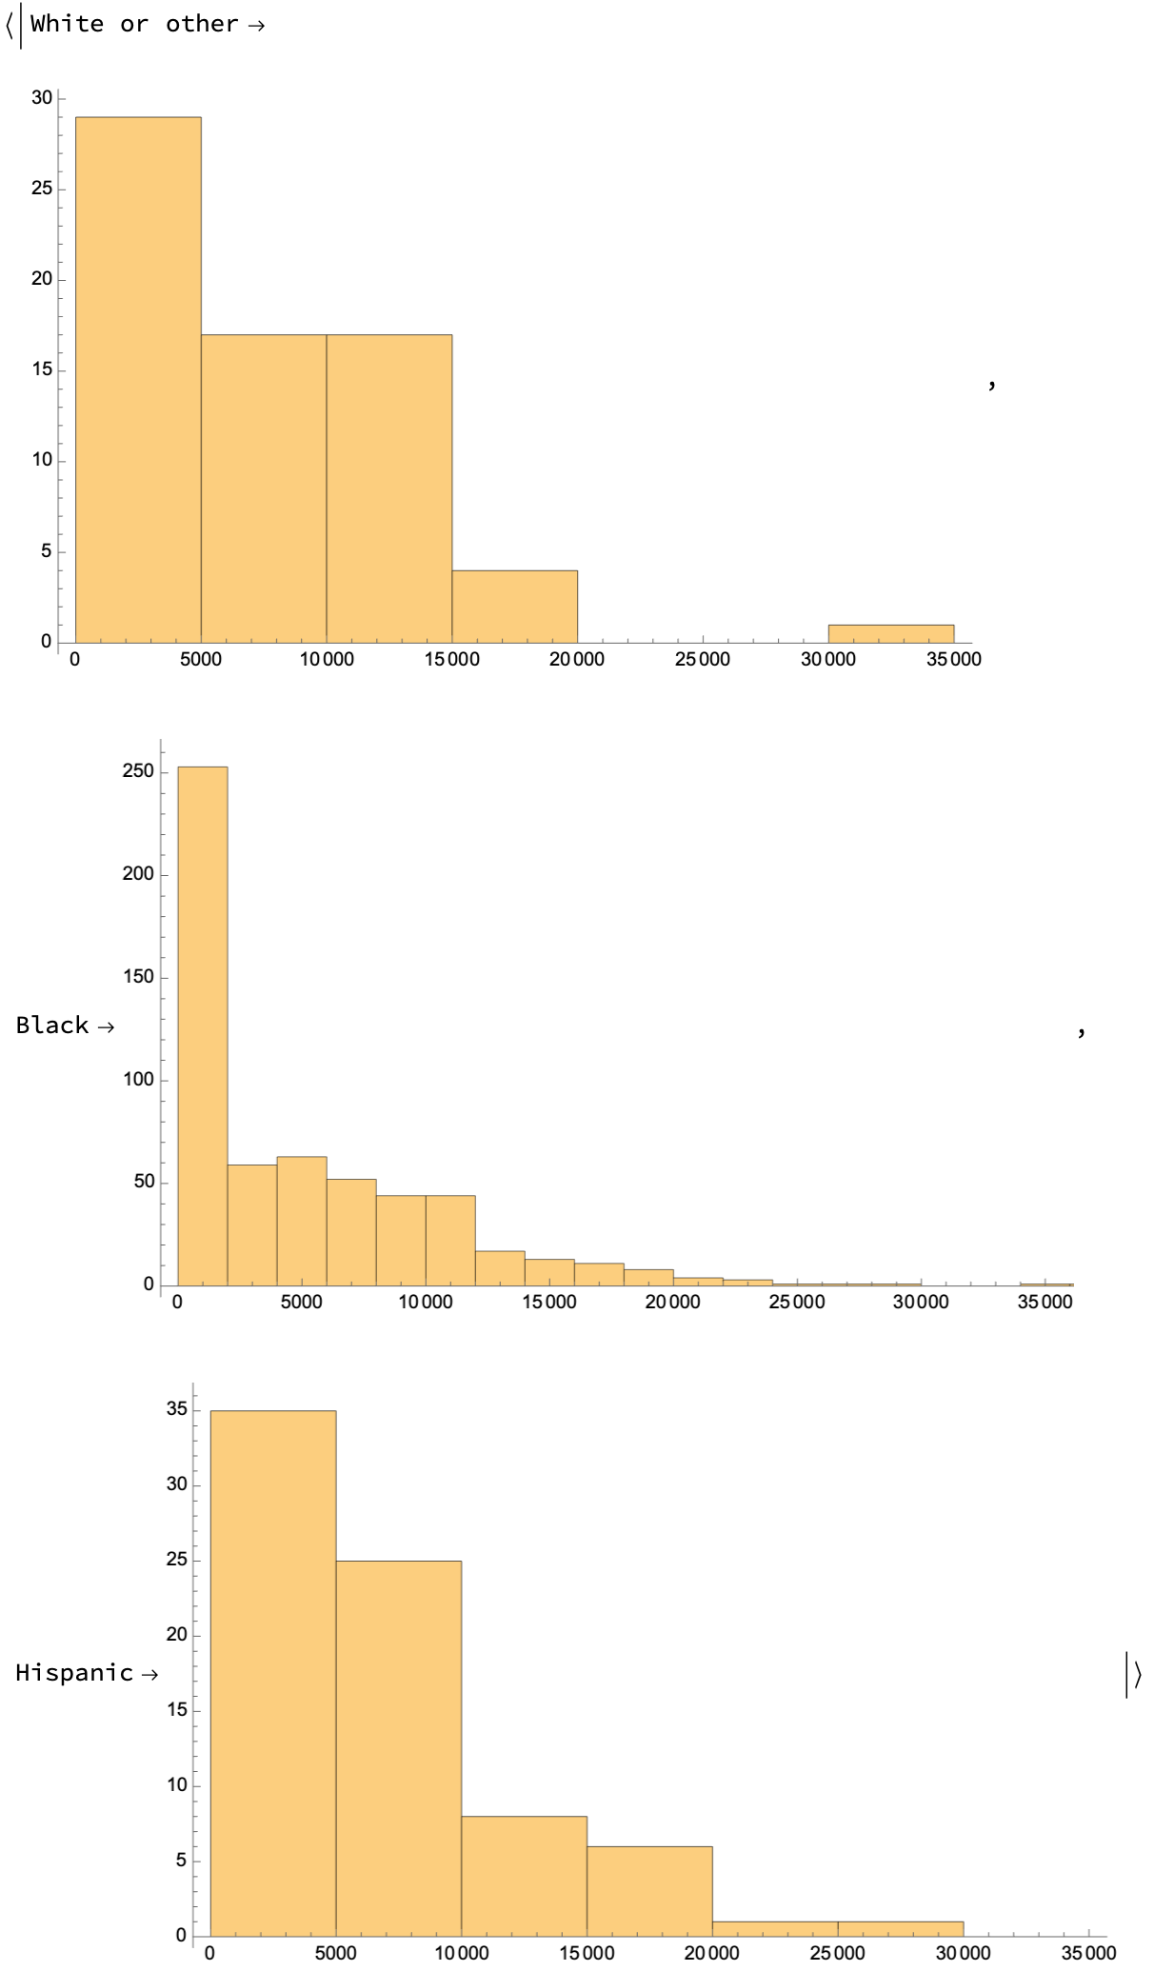
0}, "Black", {0, 1}, "Hispanic", _, "White or other"] &) -> (#re78 &), Histogram[#, PlotRange -> {{0, 35000}, All}, ImageSize -> 500] &][
Normal@jobs]](https://www.wolframcloud.com/obj/resourcesystem/images/339/339b4de4-d359-4b67-bfa5-1506d072b1ac/1524f5086d0404c0.png)
![KeySort@ResourceFunction[
ResourceObject[
Association[
"Name" -> "MapReduceOperator", "ShortName" -> "MapReduceOperator", "UUID" -> "856f4937-9a4c-44a9-88ae-cfc2efd4698f", "ResourceType" -> "Function", "Version" -> "1.0.0", "Description" -> "Like an operator form of GroupBy, but where one also specifies a reducer function to be applied", "RepositoryLocation" -> URL[
"https://www.wolframcloud.com/obj/resourcesystem/api/1.0"], "SymbolName" -> "FunctionRepository`$ad7fe533436b4f8294edfa758a34ac26`MapReduceOperator", "FunctionLocation" -> CloudObject[
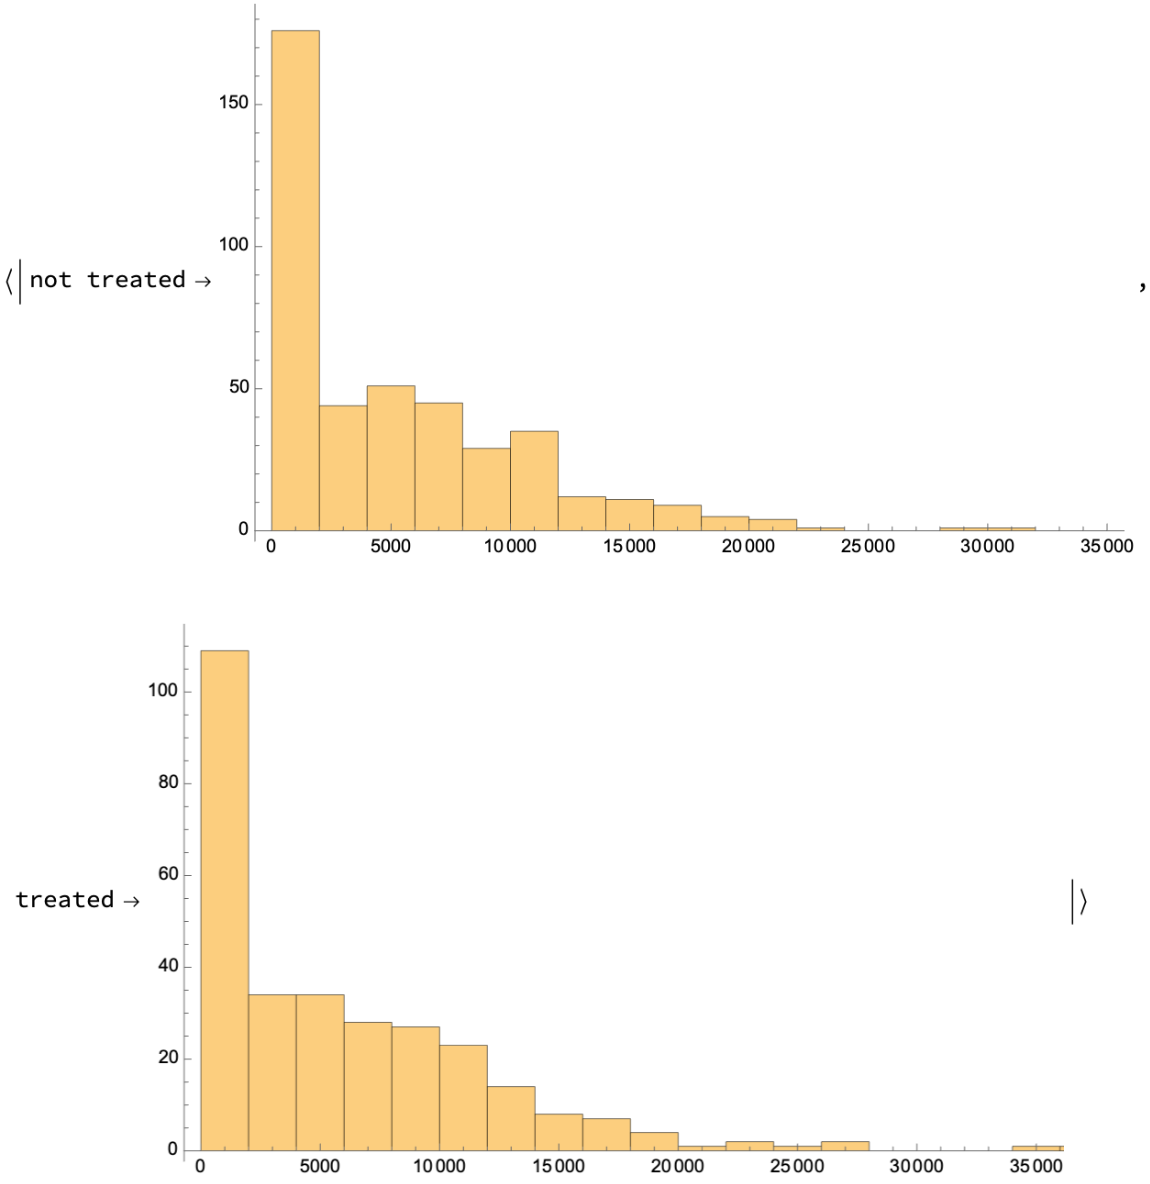
"https://www.wolframcloud.com/obj/6d981522-1eb3-4b54-84f6-55667fb2e236"]], ResourceSystemBase -> Automatic]][(If[#treated == 1, "treated", "not treated"] &) -> (#re78 &), Histogram[#, PlotRange -> {{0, 35000}, All}, ImageSize -> 500] &][
Normal@jobs]](https://www.wolframcloud.com/obj/resourcesystem/images/339/339b4de4-d359-4b67-bfa5-1506d072b1ac/75bebba5c974aeb3.png)
![jobslmf = Query[LinearModelFit[#, {1, black, hispanic, nodegree, age, education, married, re74, re75, u74, u75, treatment}, {black, hispanic, nodegree, age, education, married, re74, re75, u74, u75, treatment}, NominalVariables -> {black, hispanic, nodegree, married, u74, u75, treatment}] &, KeyTake[{"black", "hispanic", "nodegree", "age", "education", "married", "re74", "re75", "u74", "u75", "treated", "re78"}] /* Values][jobs]](https://www.wolframcloud.com/obj/resourcesystem/images/339/339b4de4-d359-4b67-bfa5-1506d072b1ac/3ac7fc4af0d724a2.png)

![jobslomf = Query[LogitModelFit[#, {1, black, hispanic, nodegree, age, education,
married, re74, re75, u74, u75}, {black, hispanic, nodegree, age, education, married, re74, re75, u74, u75}, NominalVariables -> {black, hispanic, nodegree, married, u74, u75}] &, KeyTake[{"black", "hispanic", "nodegree", "age", "education", "married", "re74", "re75", "u74", "u75", "treated"}] /* Values][
jobs]](https://www.wolframcloud.com/obj/resourcesystem/images/339/339b4de4-d359-4b67-bfa5-1506d072b1ac/48a54251e827d54e.png)

![(jobspromf = Query[ProbitModelFit[#, {1, black, hispanic, nodegree, age, education, married, re74, re75, u74, u75}, {black, hispanic, nodegree, age, education, married, re74, re75, u74, u75}, NominalVariables -> {black, hispanic, nodegree, married, u74, u75}] &, KeyTake[{"black", "hispanic", "nodegree", "age", "education", "married", "re74", "re75", "u74", "u75", "treated"}] /* Values][jobs])[{"ParameterTable", "CraggUhlerPseudoRSquared"}]](https://www.wolframcloud.com/obj/resourcesystem/images/339/339b4de4-d359-4b67-bfa5-1506d072b1ac/798145be027cbdf5.png)

![cl = Query[Classify[#, TrainingProgressReporting -> None] &, KeyTake[{"black", "hispanic", "nodegree", "age", "education", "married", "re74", "re75", "u74", "u75", "treated"}] /* Values /* (Most@# -> Last@# &)][training]](https://www.wolframcloud.com/obj/resourcesystem/images/339/339b4de4-d359-4b67-bfa5-1506d072b1ac/2c0ca404bd38c158.png)
![cmo = Query[ClassifierMeasurements[cl, #] &, KeyTake[{"black", "hispanic", "nodegree", "age", "education", "married", "re74", "re75", "u74", "u75", "treated"}] /* Values /* (Most@# -> Last@# &)][test]](https://www.wolframcloud.com/obj/resourcesystem/images/339/339b4de4-d359-4b67-bfa5-1506d072b1ac/35fbc3aed64cb54e.png)

![nonanomalousControl = Query[Select[#treat == 0 && Not[adfTreated[KeyDrop[#, {"treat", "re78"}], AcceptanceThreshold -> 0.175]] &]][lalonde] // ResourceFunction[
ResourceObject[
Association[
"Name" -> "FormatDataset", "ShortName" -> "FormatDataset", "UUID" -> "76670bca-1587-4e7e-9e89-5b698a30759d", "ResourceType" -> "Function", "Version" -> "1.0.0", "Description" -> "Format a dataset using a given set of option values", "RepositoryLocation" -> URL[
"https://www.wolframcloud.com/obj/resourcesystem/api/1.0"], "SymbolName" -> "FunctionRepository`$66a3086203b4405b88cdb0de8a5c3128`FormatDataset", "FunctionLocation" -> CloudObject[
"https://www.wolframcloud.com/obj/70389ad6-7dbc-48c8-b898-72c65c00f14e"]], ResourceSystemBase -> Automatic]][MaxItems -> 5]](https://www.wolframcloud.com/obj/resourcesystem/images/339/339b4de4-d359-4b67-bfa5-1506d072b1ac/2dc808bf6c7853fb.png)
![nonanomalousTreated = Query[Select[#treat == 1 && Not[adfControl[KeyDrop[#, {"treat", "re78"}], AcceptanceThreshold -> 0.1]] &]][lalonde] // ResourceFunction[
ResourceObject[
Association[
"Name" -> "FormatDataset", "ShortName" -> "FormatDataset", "UUID" -> "76670bca-1587-4e7e-9e89-5b698a30759d", "ResourceType" -> "Function", "Version" -> "1.0.0", "Description" -> "Format a dataset using a given set of option values", "RepositoryLocation" -> URL[
"https://www.wolframcloud.com/obj/resourcesystem/api/1.0"], "SymbolName" -> "FunctionRepository`$66a3086203b4405b88cdb0de8a5c3128`FormatDataset", "FunctionLocation" -> CloudObject[
"https://www.wolframcloud.com/obj/70389ad6-7dbc-48c8-b898-72c65c00f14e"]], ResourceSystemBase -> Automatic]][MaxItems -> 5]](https://www.wolframcloud.com/obj/resourcesystem/images/339/339b4de4-d359-4b67-bfa5-1506d072b1ac/0d4f0a4afb679b24.png)

![nonanomalousControl2 = Query[Select[#treat == 0 && Not[adfTreated[KeyDrop[#, {"treat", "re78"}], AcceptanceThreshold -> 0.1]] &]][lalonde] // ResourceFunction[
ResourceObject[
Association[
"Name" -> "FormatDataset", "ShortName" -> "FormatDataset", "UUID" -> "76670bca-1587-4e7e-9e89-5b698a30759d", "ResourceType" -> "Function", "Version" -> "1.0.0", "Description" -> "Format a dataset using a given set of option values", "RepositoryLocation" -> URL[
"https://www.wolframcloud.com/obj/resourcesystem/api/1.0"], "SymbolName" -> "FunctionRepository`$66a3086203b4405b88cdb0de8a5c3128`FormatDataset", "FunctionLocation" -> CloudObject[
"https://www.wolframcloud.com/obj/70389ad6-7dbc-48c8-b898-72c65c00f14e"]], ResourceSystemBase -> Automatic]][MaxItems -> 5]](https://www.wolframcloud.com/obj/resourcesystem/images/339/339b4de4-d359-4b67-bfa5-1506d072b1ac/5eb94aeab877e468.png)

![DistributionChart[
Normal[Query[
GroupBy[If[#treat == 1, "treated", "control"] &] /* KeyTake[{"control", "treated"}], All, #re78 &][matched2]], ChartLegends -> {"control", "treated"}, ChartStyle -> {Red, Blue}, PlotLabel -> "Distribution of 1978 earnings\namong treated and untreated groups after matching"]](https://www.wolframcloud.com/obj/resourcesystem/images/339/339b4de4-d359-4b67-bfa5-1506d072b1ac/232a1111f7cb4412.png)
![lalondeCounterfactual = Query[RandomSample, Association[KeyDrop[#, {"treat", "re78"}], "treatedRE78" -> If[#treat == 1, #re78, Missing[]], "untreatedRE78" -> If[#treat == 0, #re78, Missing[]]] &][
lalonde] // ResourceFunction[
ResourceObject[
Association[
"Name" -> "FormatDataset", "ShortName" -> "FormatDataset", "UUID" -> "76670bca-1587-4e7e-9e89-5b698a30759d", "ResourceType" -> "Function", "Version" -> "1.0.0", "Description" -> "Format a dataset using a given set of option values", "RepositoryLocation" -> URL[
"https://www.wolframcloud.com/obj/resourcesystem/api/1.0"], "SymbolName" -> "FunctionRepository`$66a3086203b4405b88cdb0de8a5c3128`FormatDataset", "FunctionLocation" -> CloudObject[
"https://www.wolframcloud.com/obj/70389ad6-7dbc-48c8-b898-72c65c00f14e"]], ResourceSystemBase -> Automatic]][MaxItems -> 5]](https://www.wolframcloud.com/obj/resourcesystem/images/339/339b4de4-d359-4b67-bfa5-1506d072b1ac/64172cc5a671b260.png)
![lalondeSynthesizedMultiple = Join @@ Table[
Query[SynthesizeMissingValues[#, TrainingProgressReporting -> None, Method -> <|"LearningMethod" -> "Multinormal", "EvaluationStrategy" -> "RandomSampling"|>] &][
lalondeCounterfactual], 20] // ResourceFunction[
ResourceObject[
Association[
"Name" -> "FormatDataset", "ShortName" -> "FormatDataset", "UUID" -> "76670bca-1587-4e7e-9e89-5b698a30759d", "ResourceType" -> "Function", "Version" -> "1.0.0", "Description" -> "Format a dataset using a given set of option values", "RepositoryLocation" -> URL[
"https://www.wolframcloud.com/obj/resourcesystem/api/1.0"], "SymbolName" -> "FunctionRepository`$66a3086203b4405b88cdb0de8a5c3128`FormatDataset", "FunctionLocation" -> CloudObject[
"https://www.wolframcloud.com/obj/70389ad6-7dbc-48c8-b898-72c65c00f14e"]], ResourceSystemBase -> Automatic]][MaxItems -> 10]](https://www.wolframcloud.com/obj/resourcesystem/images/339/339b4de4-d359-4b67-bfa5-1506d072b1ac/5dee562acc8048b1.png)