Wolfram Data Repository
Immediate Computable Access to Curated Contributed Data
Dataset of deaths and crude rates of fatal injuries in the United States from 1999 to 2014
Originator: Centers for Disease Control and Prevention (CDC)
(8 columns, 5460 rows)
Retrieve the resource:
| In[1]:= |
| Out[1]= |  |
Retrieve the default content:
| In[2]:= |
| Out[2]= | 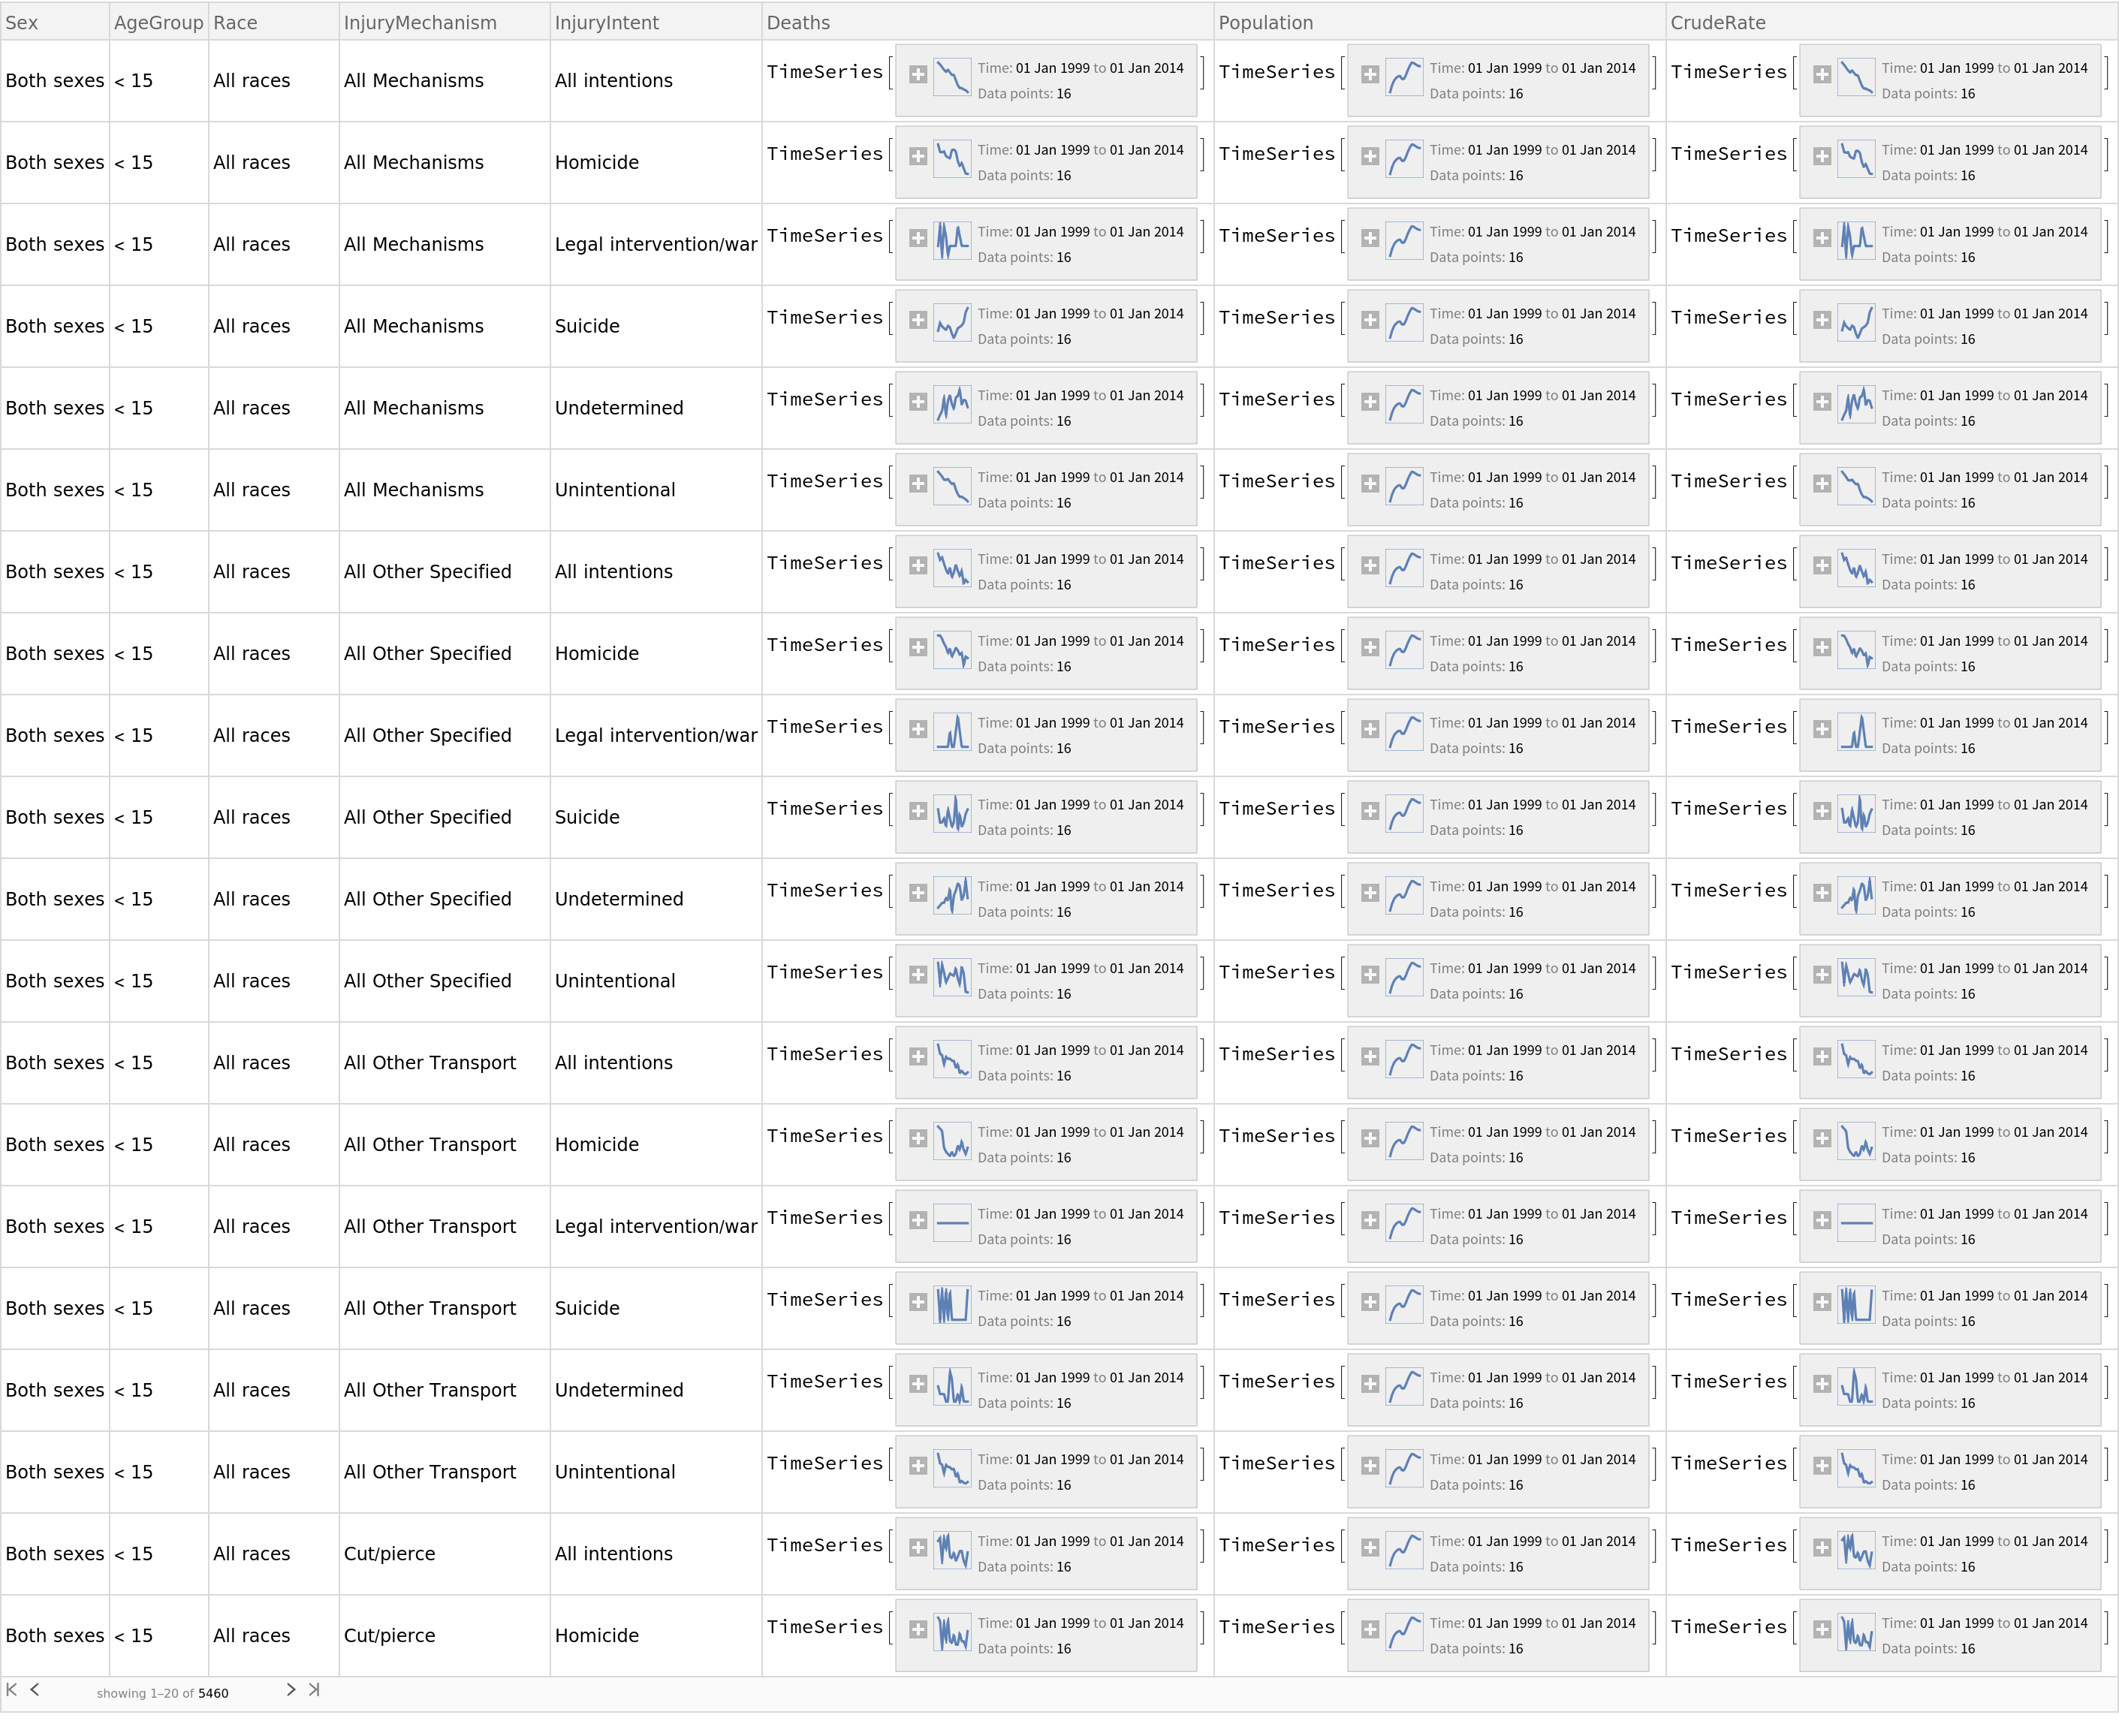 |
Review the historical trend of homicide mechanisms in the U.S.:
| In[3]:= | ![ResourceData["3d0d2bb3-a2aa-43cc-89b1-f84c84cf1d65"][
Select[#AgeGroup == "All Ages" && #Sex == "Both sexes" && #Race == "All races" && #InjuryIntent == "Homicide" &], {"InjuryMechanism", "Deaths"}][All, DateListPlot[#["Deaths"], PlotLabel -> #["InjuryMechanism"]] &] // Normal](https://www.wolframcloud.com/obj/resourcesystem/images/3d0/3d0d2bb3-a2aa-43cc-89b1-f84c84cf1d65/30207dbccacad864.png) |
| Out[3]= | 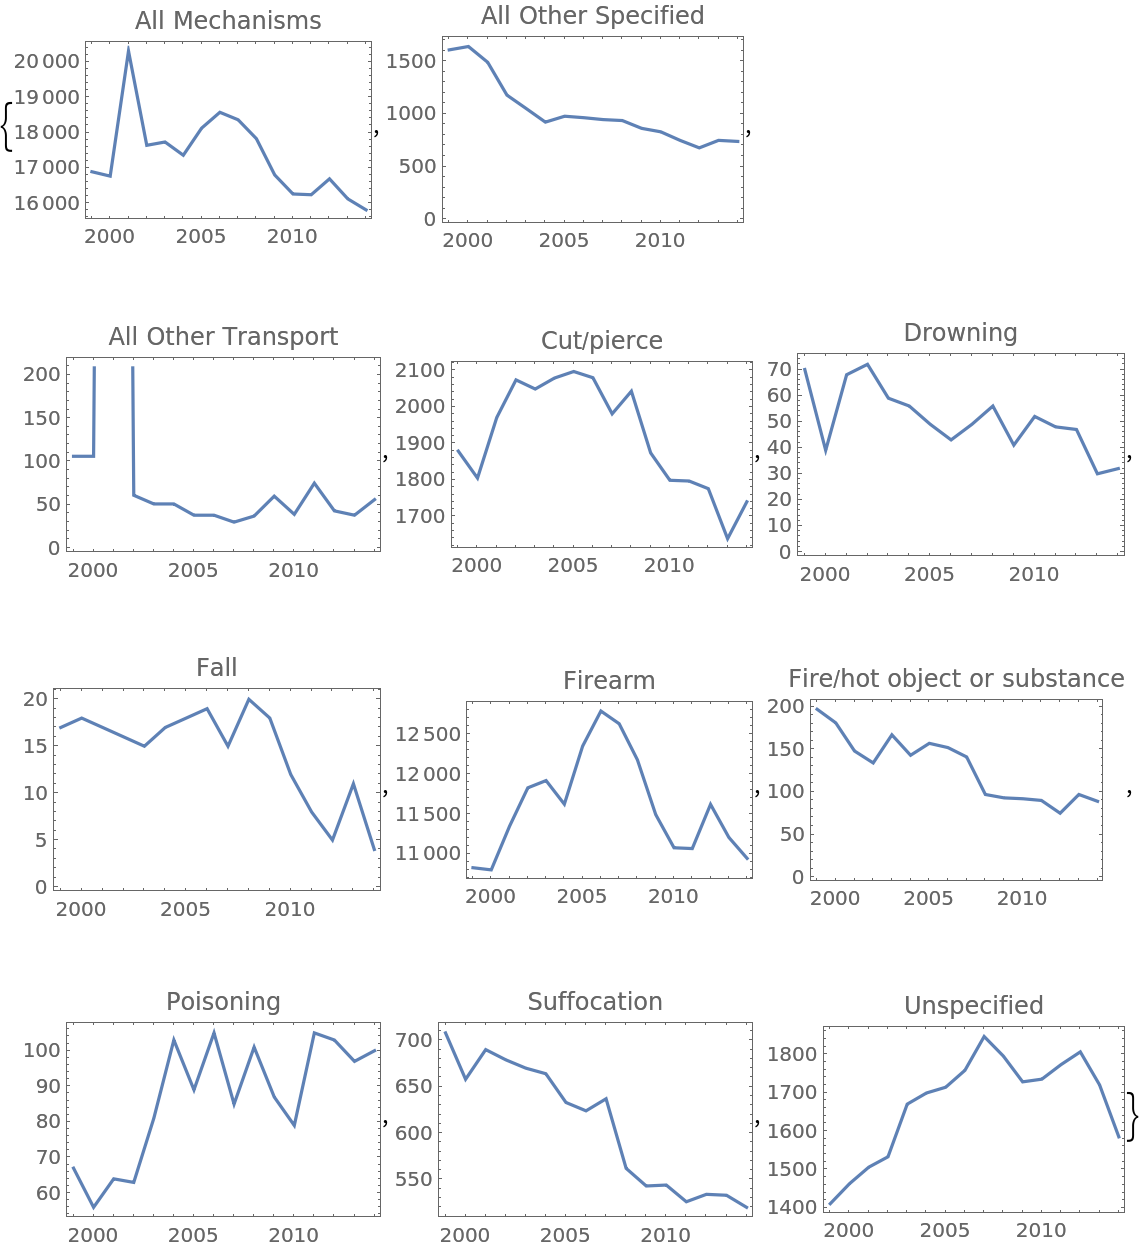 |
Plot age group distribution for male homicides in 2014:
| In[4]:= | ![BarChart[#1, ChartLabels -> #2] & @@ (ResourceData[
"US Fatal Injuries 1999-2014"][
Select[#Sex == "Male" && #Race == "All races" && #InjuryMechanism == "All Mechanisms" && #InjuryIntent == "Homicide" &]/*
Most, {"AgeGroup", "Deaths"}][
All, <|"ageGroup" -> #AgeGroup, "deaths" -> #Deaths[DateObject[{2014, 1, 1}]]|> &] // Values // Normal // Transpose // Reverse)](https://www.wolframcloud.com/obj/resourcesystem/images/3d0/3d0d2bb3-a2aa-43cc-89b1-f84c84cf1d65/0dcf8e240f170c52.png) |
| Out[4]= | 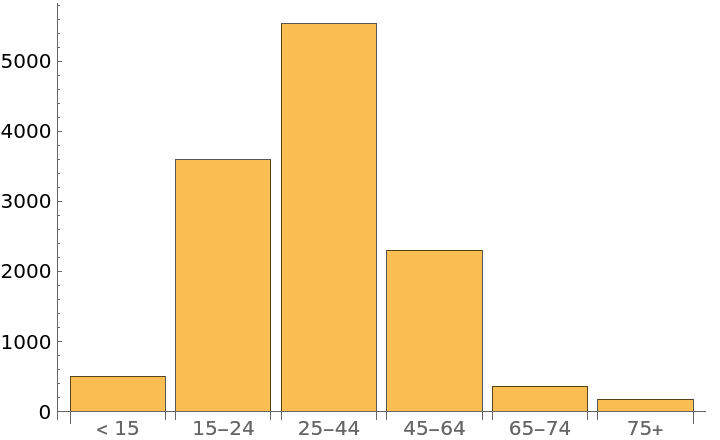 |
Diego Zviovich, "US Fatal Injuries 1999-2014" from the Wolfram Data Repository (2017)
Public Domain