Examples
Basic Examples
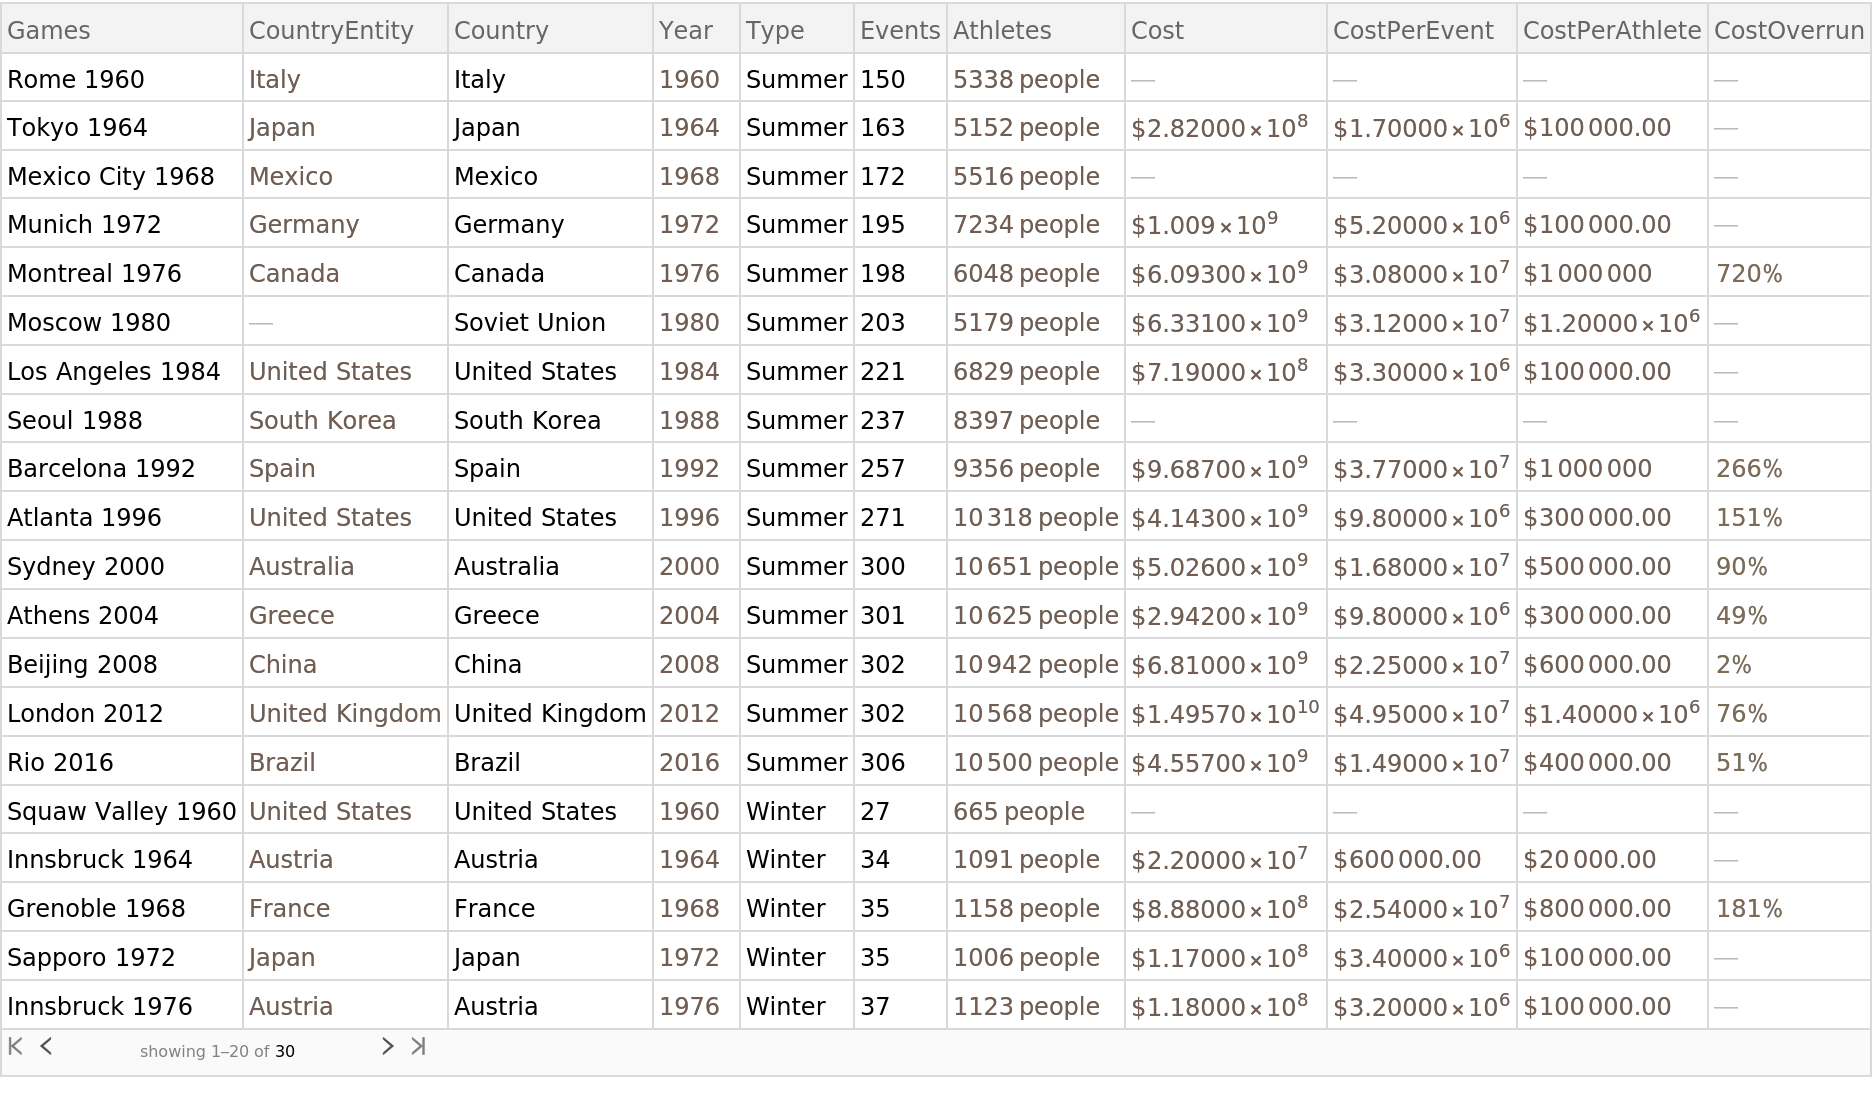
Retrieve the resource:
Retrieve the default content:
Visualization
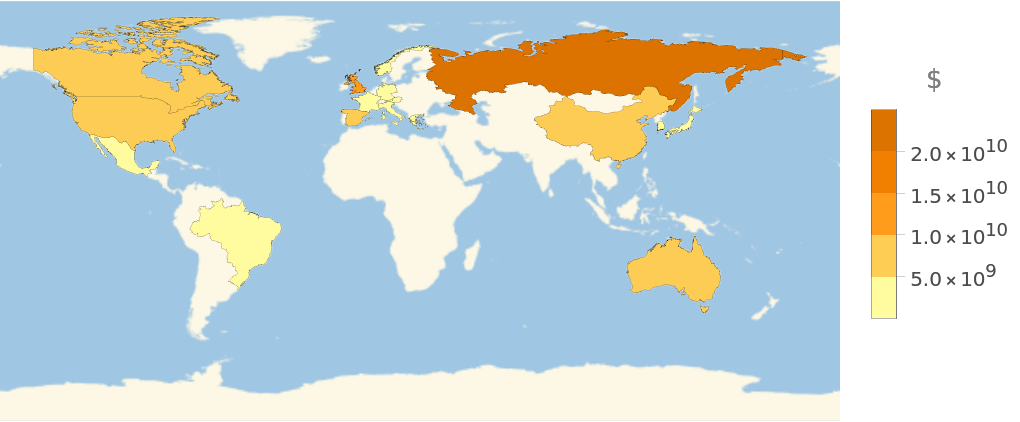
See which countries have spent the most to host the Olympic Games:
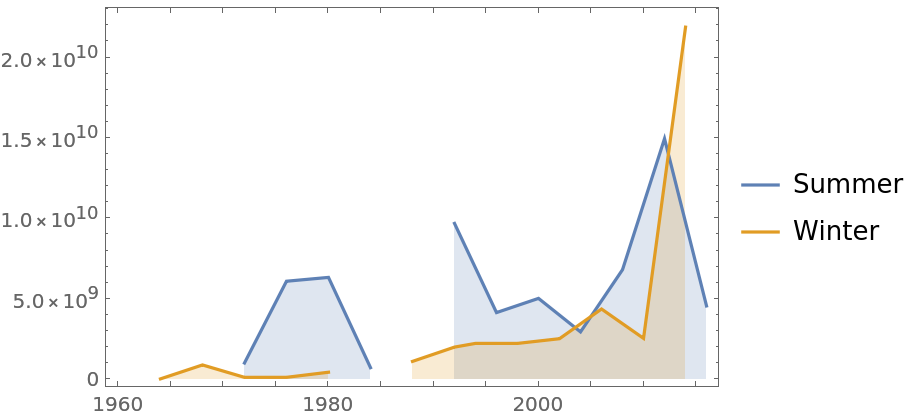
Plot costs per event over time:
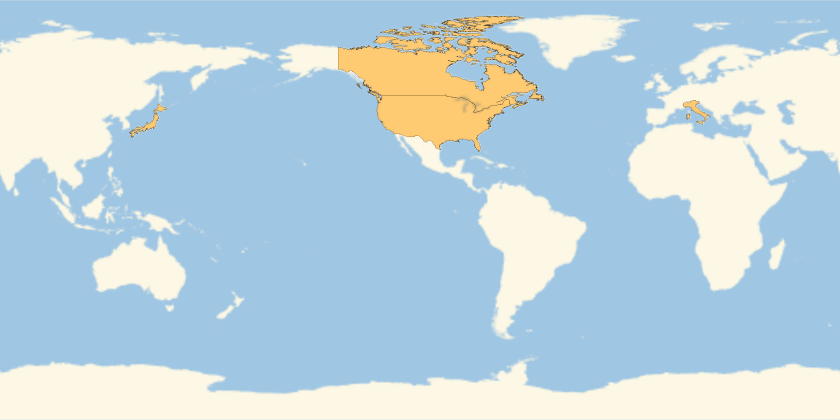
Plot the countries that have hosted both Winter and Summer Olympics:
See which countries have hosted the most Olympic Games:
Analysis
Bibliographic Citation
Wolfram Research,
"Olympic Games Costs"
from the Wolfram Data Repository
(2017)
https://doi.org/10.24097/wolfram.79874.data
https://arxiv.org/abs/1607.04484
Data Resource History
Data Downloads
Publisher Information

![GeoRegionValuePlot[
Total /@ DeleteMissing /@ GroupBy[ResourceData["Olympic Games Costs"], #CountryEntity &][All,
All, #Cost &]]](https://www.wolframcloud.com/obj/resourcesystem/images/3dc/3dc5e6b5-54f0-49c2-929f-02b8f4ce36bb/60ce7f5ee46784d4.png)
![DateListPlot[
GroupBy[ResourceData["Olympic Games Costs"], #Type &][All, All, {#Year, #Cost} &], PlotRange -> All, Filling -> Bottom]](https://www.wolframcloud.com/obj/resourcesystem/images/3dc/3dc5e6b5-54f0-49c2-929f-02b8f4ce36bb/5b028f2b6b31739d.png)
![summerHosts = Select[ResourceData["Olympic Games Costs"], #Type == "Summer" &][
All, "CountryEntity"];
winterHosts = Select[ResourceData["Olympic Games Costs"], #Type == "Winter" &][
All, "CountryEntity"];
GeoListPlot[Intersection[summerHosts, winterHosts]]](https://www.wolframcloud.com/obj/resourcesystem/images/3dc/3dc5e6b5-54f0-49c2-929f-02b8f4ce36bb/3708298d1c25db1d.png)
![BarChart[
Counts /@ SortBy[GroupBy[
ResourceData["Olympic Games Costs"], #CountryEntity &][All, All, #Type &], Length], ChartLayout -> "Stacked", BarOrigin -> Left, ChartLabels -> {Automatic, None}, ChartLegends -> {None, Automatic}]](https://www.wolframcloud.com/obj/resourcesystem/images/3dc/3dc5e6b5-54f0-49c2-929f-02b8f4ce36bb/1794f92417ba4ed6.png)
