Wolfram Data Repository
Immediate Computable Access to Curated Contributed Data
Goddard Mars Model 3 map of the gravity field of Mars
Originator: NASA
Goddard Mars Model (GMM) 3 is a global map of the gravity field of Mars. It was created by studying the flight paths of three Mars-orbiting spacecraft — Mars Global Surveyor (MGS), Mars Odyssey (ODY), and Mars Reconnaissance Orbiter (MRO).
The travel time and Doppler shift of radio signals sent between the spacecraft and the Earth-based dish antennas of the Deep Space Network are used to measure the position and velocity of each spacecraft. Over time, small variations in these orbital parameters allow scientists to build up an accurate and detailed gravity map of the red planet.
If Mars were a perfectly smooth sphere of uniform density, the gravity experienced by the spacecraft would be exactly the same everywhere. But like other rocky bodies in the solar system, including the Earth, Mars has both a bumpy surface and a lumpy interior. As the spacecraft fly in their orbits, they experience slight variations in gravity caused by both of these irregularities, variations which show up as small changes in the velocity and altitude of the three spacecraft.
The free-air gravity map shows these variations directly. The map is color-coded to display the departure from the mean gravity of Mars, in milligals, a unit of acceleration. Purple and blue mark areas where the acceleration due to gravity is lower than average, while red and white show where it's higher.
The Bouguer gravity map subtracts the effect of the bumpy surface to show the lumpiness underneath. The elevation maps from the laser altimeter on MGS were used to create a model of what the gravity would be if Mars were bumpy but not lumpy. This model was then subtracted from the free-air map to produce the Bouguer map.
The crustal thickness map is inferred from the Bouguer map: If the density of the crust is assumed to be uniform, then the gravity anomalies visible in the Bouguer gravity map can be explained by variations in the thickness of the crust. Highs in gravity indicate places where the denser mantle is closer to the surface, and hence where the crust is thinner.
The orbit analysis accounted for solar radiation pressure and for the mass and the drag of the thin Martian atmosphere. It also detected the seasonal variation in the amount of carbon dioxide locked up in the polar ice caps as they freeze and thaw.
(8192x4096 pixels)
Retrieve the ResourceObject:
| In[1]:= |
| Out[1]= |  |
View the data:
| In[2]:= |
| Out[2]= | 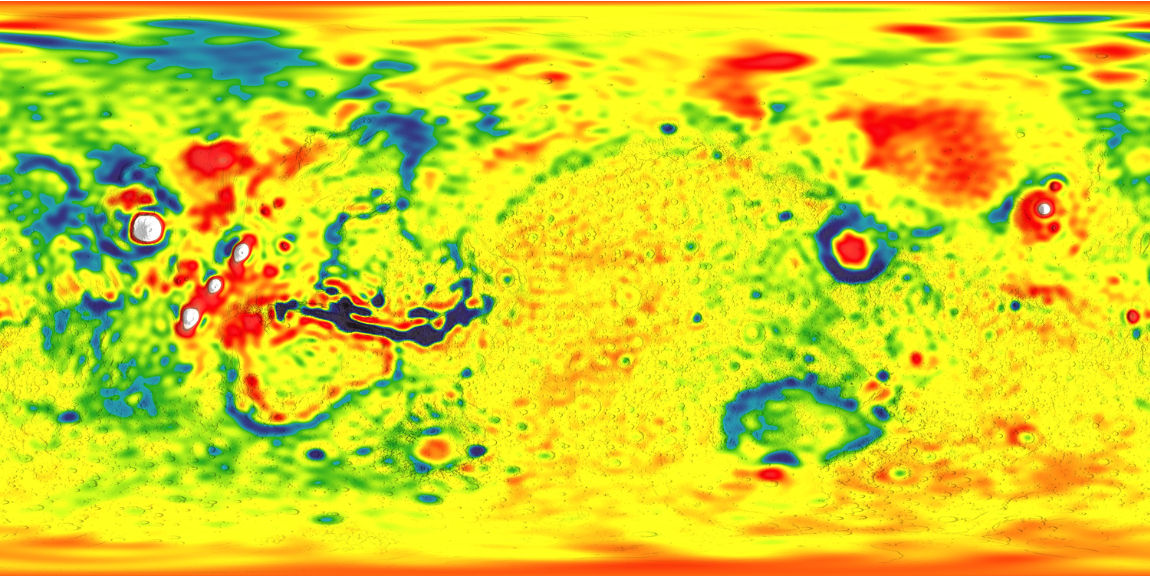 |
Show the elevation map created by the Mars Orbiter Laser Altimeter:
| In[3]:= |
| Out[3]= | 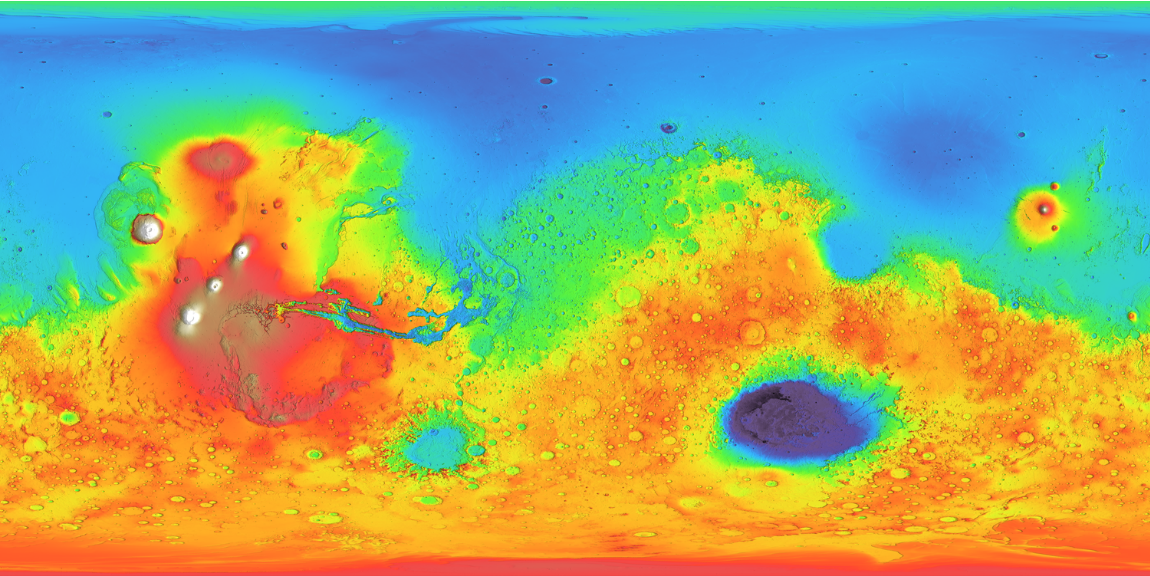 |
Wolfram Research, "GMM-3 Mars Gravity Map" from the Wolfram Data Repository (2016) https://doi.org/10.24097/wolfram.80873.data