Wolfram Data Repository
Immediate Computable Access to Curated Contributed Data
Georeferenced dataset of individual events of organized violence from the Uppsala Conflict Data Program
Originator: Uppsala Conflict Data Program
This dataset is UCDP’s most disaggregated dataset, covering individual events of organized violence (phenomena of lethal violence occurring at a given time and place). These events are sufficiently fine-grained to be geo-coded down to the level of individual villages, with temporal durations disaggregated to single, individual days.
(49 columns, 128264 rows)
Retrieve the default content:
| In[1]:= |
| Out[1]= |  |
Show the density of incidents of state-based conflict from 1989 to 2015:
| In[2]:= | ![GeoHistogram[
Select[ResourceData[
"Global Events of Organized Violence"], #TypeOfViolence == 1 &][
All, "Position"], 40, ImageSize -> Full]](https://www.wolframcloud.com/obj/resourcesystem/images/4be/4befcf8d-d341-4196-accf-99edc4ba278d/4eb627b7e0ab3714.png) |
| Out[2]= |  |
Find the 10 conflicts with the highest estimated number of civilian deaths:
| In[3]:= | ![TakeLargest[
Total /@ GroupBy[ResourceData["Global Events of Organized Violence"], "ConflictName"][All, All, "DeathsCivilians"], 10]](https://www.wolframcloud.com/obj/resourcesystem/images/4be/4befcf8d-d341-4196-accf-99edc4ba278d/14f0dcd898e21d9d.png) |
| Out[3]= |  |
Map the top 50 incidents in 2001 by estimated total deaths:
| In[4]:= | ![GeoBubbleChart[
TakeLargestBy[
Select[ResourceData[
"Global Events of Organized Violence"], #DateStart["Year"] == 2001 &], #BestEst &, 50][All, {#Position -> #BestEst} &], ImageSize -> Full]](https://www.wolframcloud.com/obj/resourcesystem/images/4be/4befcf8d-d341-4196-accf-99edc4ba278d/53405c8303512657.png) |
| Out[4]= |  |
Show counts of violent incidents by dyad (pair of conflicting primary parties) in Iraq in 2005:
| In[5]:= | ![BarChart[
Sort[Length /@ GroupBy[Select[
ResourceData[
"Global Events of Organized Violence"], #Country == Entity["Country", "Iraq"] && #DateStart["Year"] == 2005 &], #DyadName &]], BarOrigin -> Left, ChartLabels -> Automatic, ImageSize -> Full]](https://www.wolframcloud.com/obj/resourcesystem/images/4be/4befcf8d-d341-4196-accf-99edc4ba278d/124a1e8a4c844bd1.png) |
| Out[5]= | 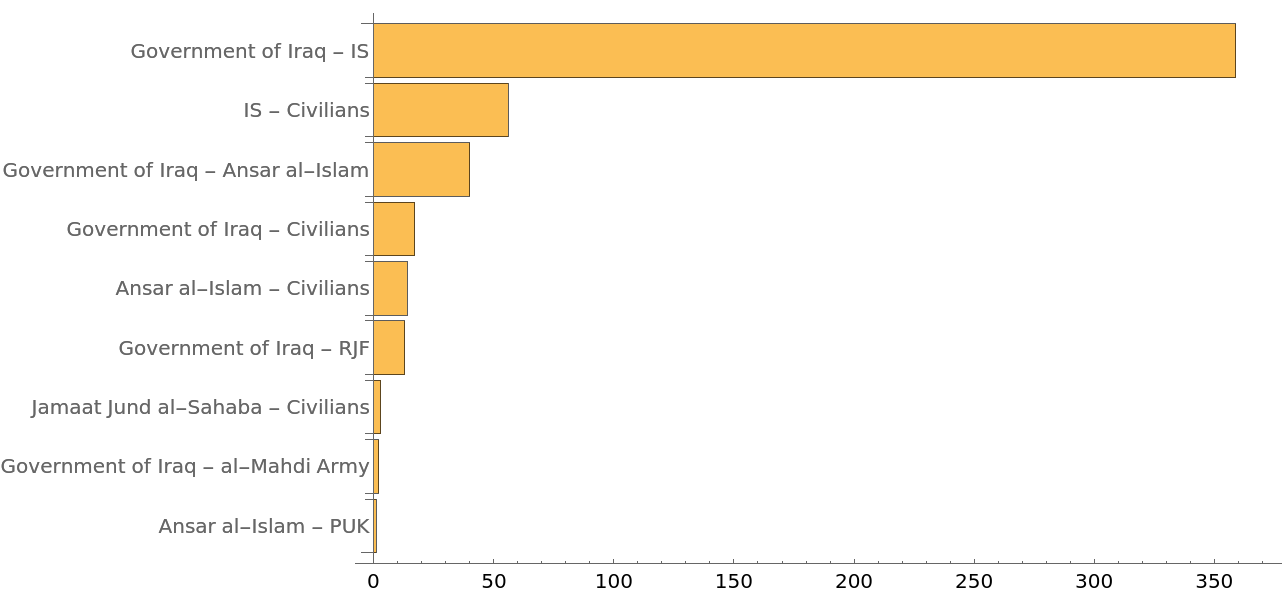 |
Plot incidents of violence involving the Islamic State by month:
| In[6]:= | ![DateHistogram[
Select[ResourceData[
"Global Events of Organized Violence"], #SideA == "IS" || #SideB == "IS" &][All, "DateStart"], "Month"]](https://www.wolframcloud.com/obj/resourcesystem/images/4be/4befcf8d-d341-4196-accf-99edc4ba278d/7b29c8693af63bb7.png) |
| Out[6]= | 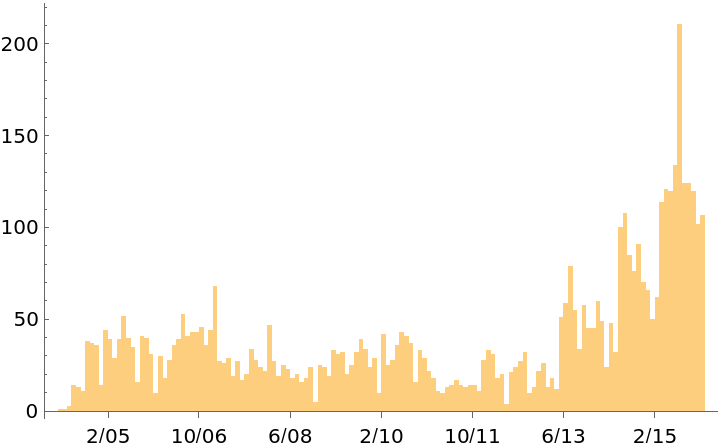 |
Show estimated deaths from incidents in Pakistan from 1989 to 2015:
| In[7]:= | ![DateListPlot[
Total /@ GroupBy[Select[
ResourceData[
"Global Events of Organized Violence"], #Country == Entity["Country", "Pakistan"] &], #DateStart &][All, All, "BestEst"], PlotRange -> All]](https://www.wolframcloud.com/obj/resourcesystem/images/4be/4befcf8d-d341-4196-accf-99edc4ba278d/57363d7516340a07.png) |
| Out[7]= | 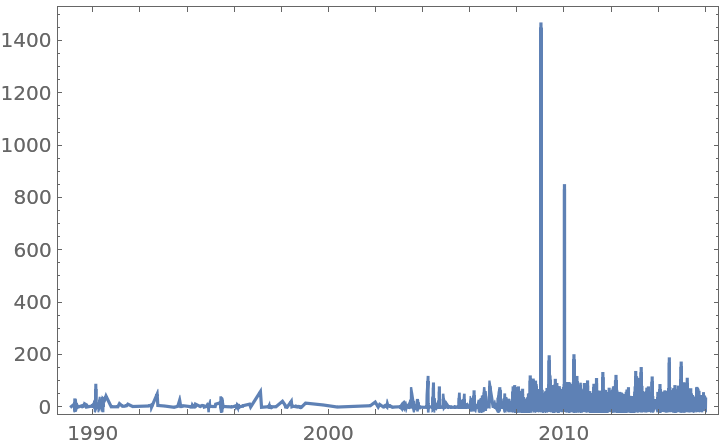 |
Wolfram Research, "Global Events of Organized Violence" from the Wolfram Data Repository (2017) https://doi.org/10.24097/wolfram.41759.data