Sample Data: Liverpool Cancer

Source Notebook

Locations of cancer cases in North Liverpool, UK, annotated with subject type (case or control) marks

Details

Locations of cancer cases in North Liverpool, UK, in the observation region that is the polygon of North Liverpool, annotated with subject type (case or control) marks.

Examples

Basic Examples (2) 

Retrieve the data:

In[1]:=
ResourceData[\!\(\*
TagBox["\"\<Sample Data: Liverpool Cancer\>\"",
#& ,
BoxID -> "ResourceTag-Sample Data: Liverpool Cancer-Input",
AutoDelete->True]\), "Data"]
Out[1]=

Summary of the spatial point data:

In[2]:=
ResourceData[\!\(\*
TagBox["\"\<Sample Data: Liverpool Cancer\>\"",
#& ,
BoxID -> "ResourceTag-Sample Data: Liverpool Cancer-Input",
AutoDelete->True]\), "Data"]["Summary"]
Out[2]=

Visualizations (2) 

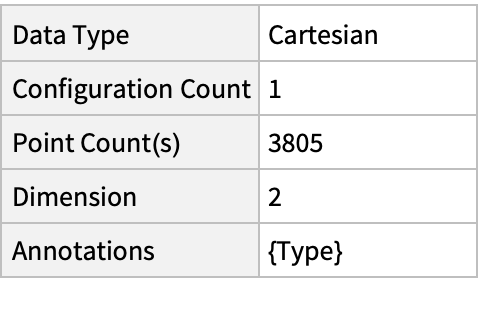
Plot the spatial point data:

In[3]:=
ListPlot[ResourceData[\!\(\*
TagBox["\"\<Sample Data: Liverpool Cancer\>\"",
#& ,
BoxID -> "ResourceTag-Sample Data: Liverpool Cancer-Input",
AutoDelete->True]\), "Data"]]
Out[3]=

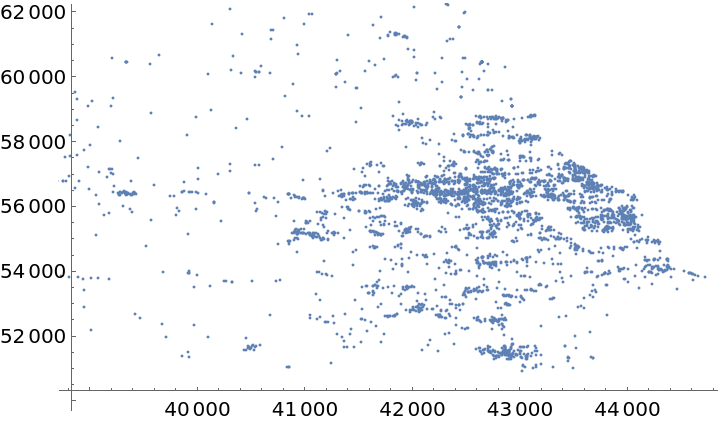
Visualize the locations with type annotations:

In[4]:=
PointValuePlot[ResourceData[\!\(\*
TagBox["\"\<Sample Data: Liverpool Cancer\>\"",
#& ,
BoxID -> "ResourceTag-Sample Data: Liverpool Cancer-Input",
AutoDelete->True]\), "Data"], PlotLegends -> Automatic]
Out[4]=

Analysis (1) 

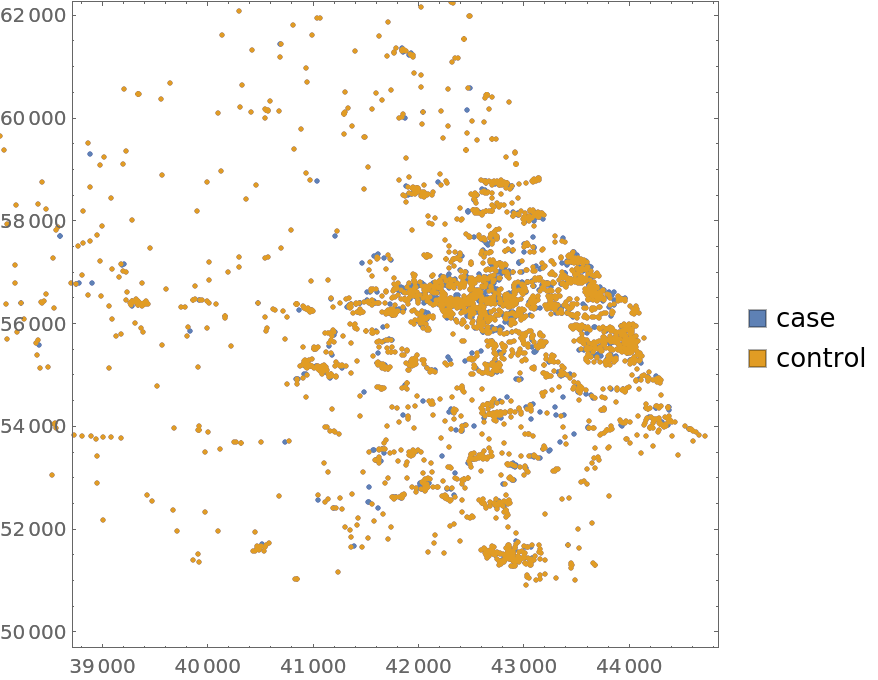
Test for complete spacial randomness:

In[5]:=
SpatialRandomnessTest[ResourceData[\!\(\*
TagBox["\"\<Sample Data: Liverpool Cancer\>\"",
#& ,
BoxID -> "ResourceTag-Sample Data: Liverpool Cancer-Input",
AutoDelete->True]\), "Data"], {"PValue", "TestConclusion"}]
Out[5]=

Gosia Konwerska, "Sample Data: Liverpool Cancer" from the Wolfram Data Repository (2021)  

Data Resource History

Source Metadata

Data Downloads

Publisher Information