Wolfram Data Repository
Immediate Computable Access to Curated Contributed Data
Data on suicides by US County from 1999-2013
Number of suicide deaths and rates of suicide by US County per year from 1999 to 2013 from the CDC WONDER database.
(6 columns, 1264 rows)
Retrieve the ResourceObject:
| In[1]:= |
| Out[1]= |  |
View the data:
| In[2]:= |
| Out[2]= | 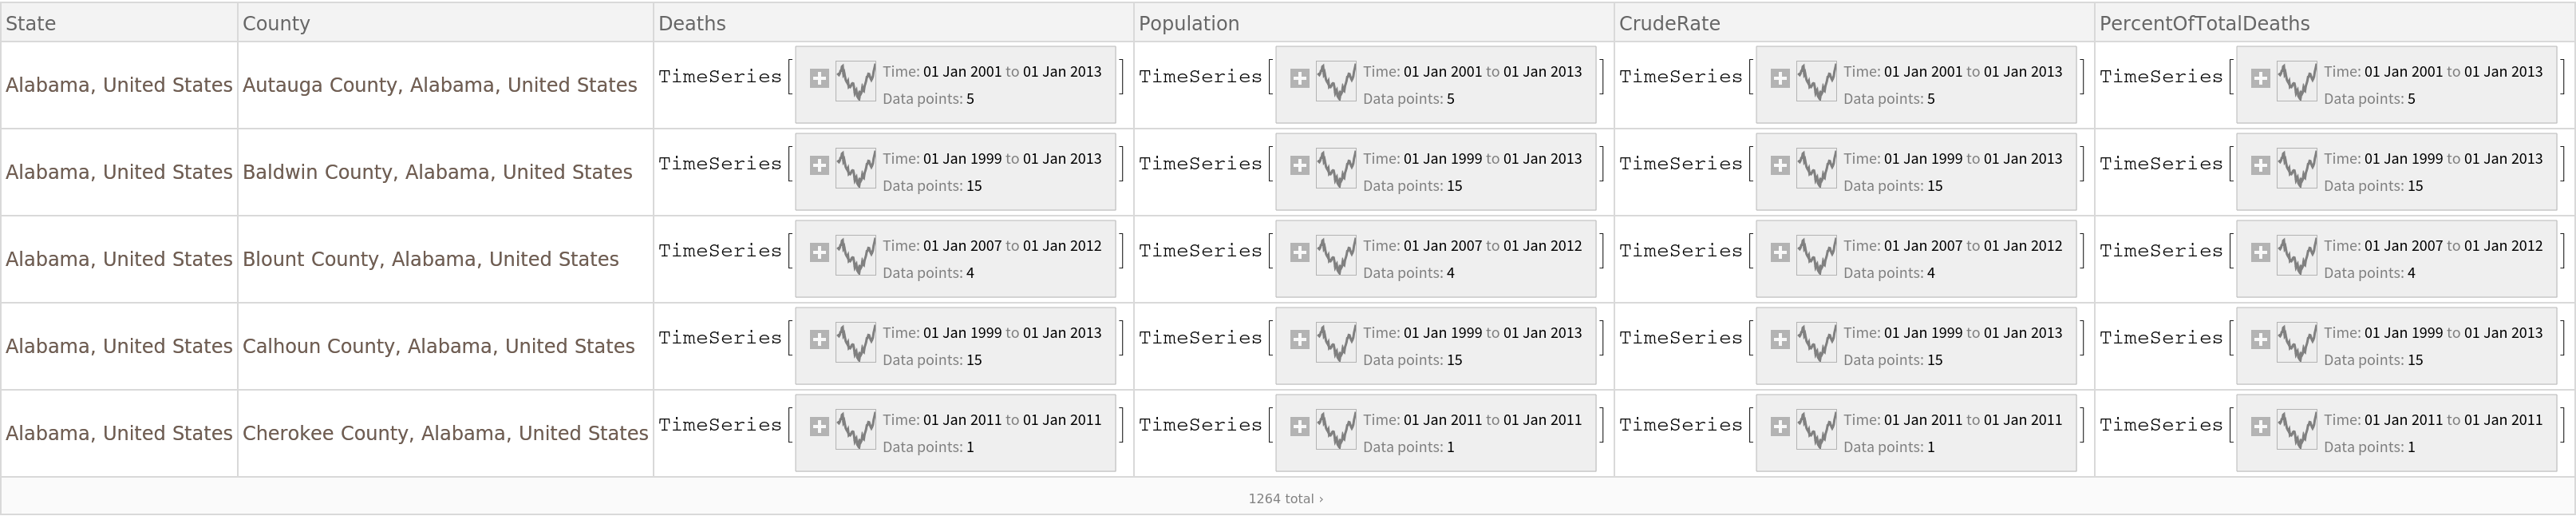 |
Generate a plot of the deaths from 1999-2013 in five counties in Alabama:
| In[3]:= |
| Out[3]= | 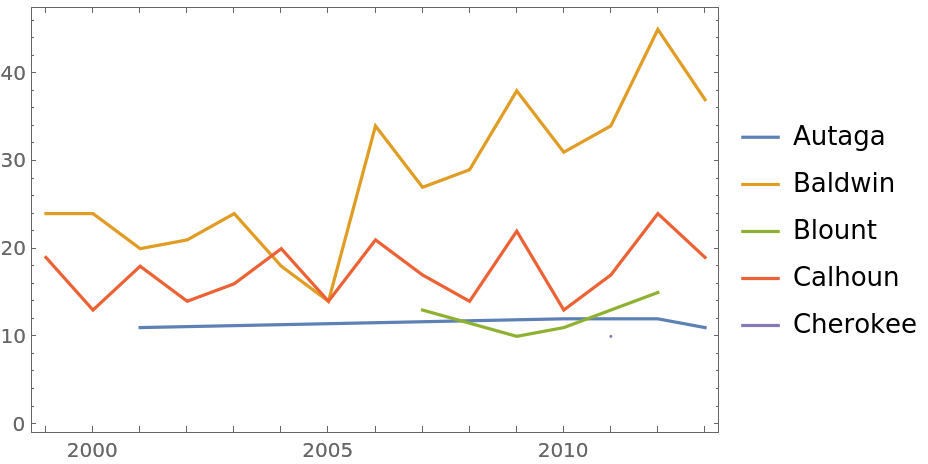 |
Wolfram Research, "US County Suicide Data 1999-2013" from the Wolfram Data Repository (2016) https://doi.org/10.24097/wolfram.18135.data