Wolfram Data Repository
Immediate Computable Access to Curated Contributed Data
A three-dimensional graph, where lymphatic organs and junctions are modeled as nodes and lymphatic vessels as edges
(996 vertices, 1117 edges)
Retrieve the human lymphatic network:
| In[1]:= |
| Out[1]= | 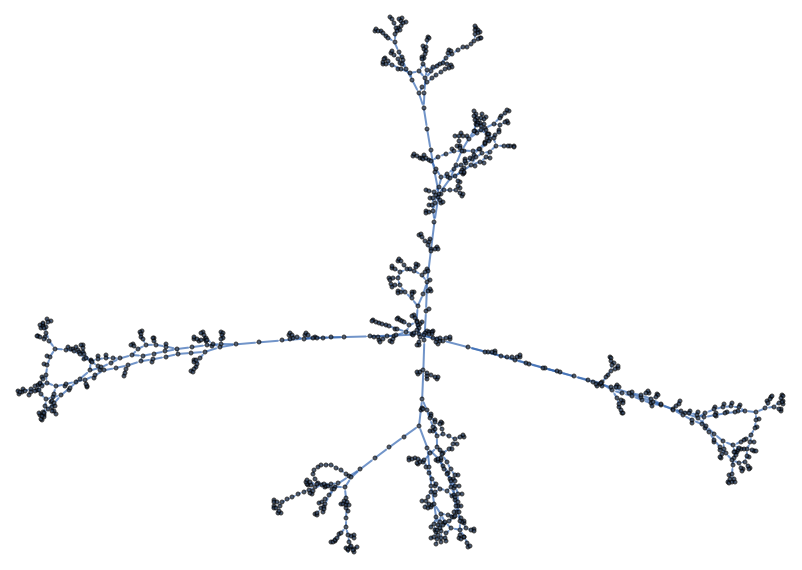 |
Retrieve and visualize the human lymphatic network using anatomically accurate coordinates:
| In[2]:= | ![Graph3D[ResourceData[\!\(\*
TagBox["\"\<The Human Lymphatic System\>\"",
#& ,
BoxID -> "ResourceTag-The Human Lymphatic System-Input",
AutoDelete->True]\)], VertexCoordinates -> ResourceData[\!\(\*
TagBox["\"\<The Human Lymphatic System\>\"",
#& ,
BoxID -> "ResourceTag-The Human Lymphatic System-Input",
AutoDelete->True]\), "Position"], EdgeShapeFunction -> "Line", VertexSize -> 300]](https://www.wolframcloud.com/obj/resourcesystem/images/63e/63e705c2-bcc6-4458-959d-bd5f8baafd30/1ba1a741ee80622f.png) |
| Out[2]= | 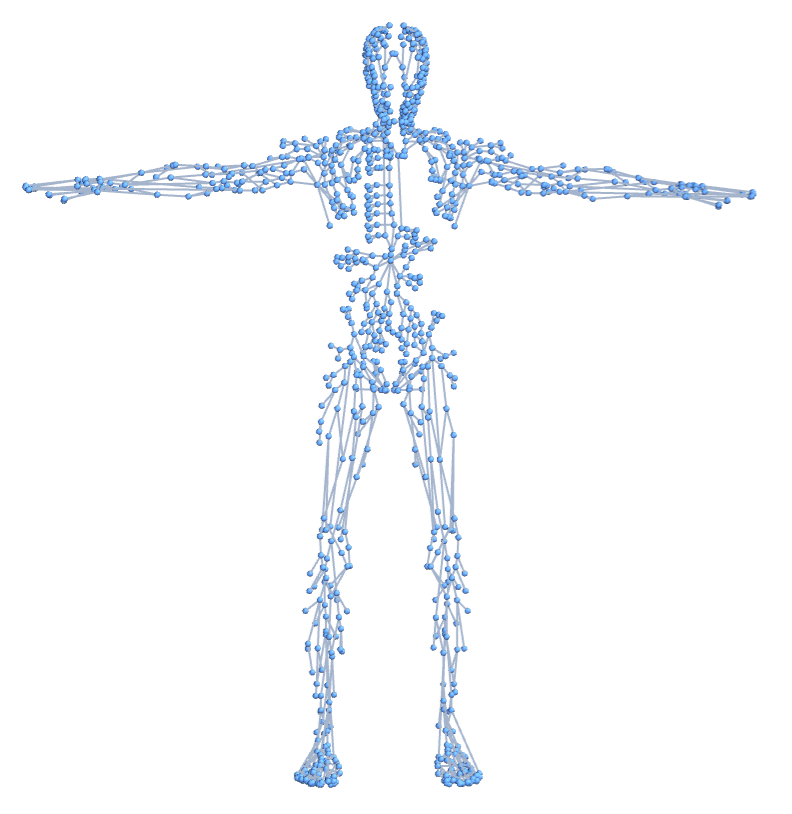 |
Visualize the nodes coordinates:
| In[3]:= |
| Out[3]= | 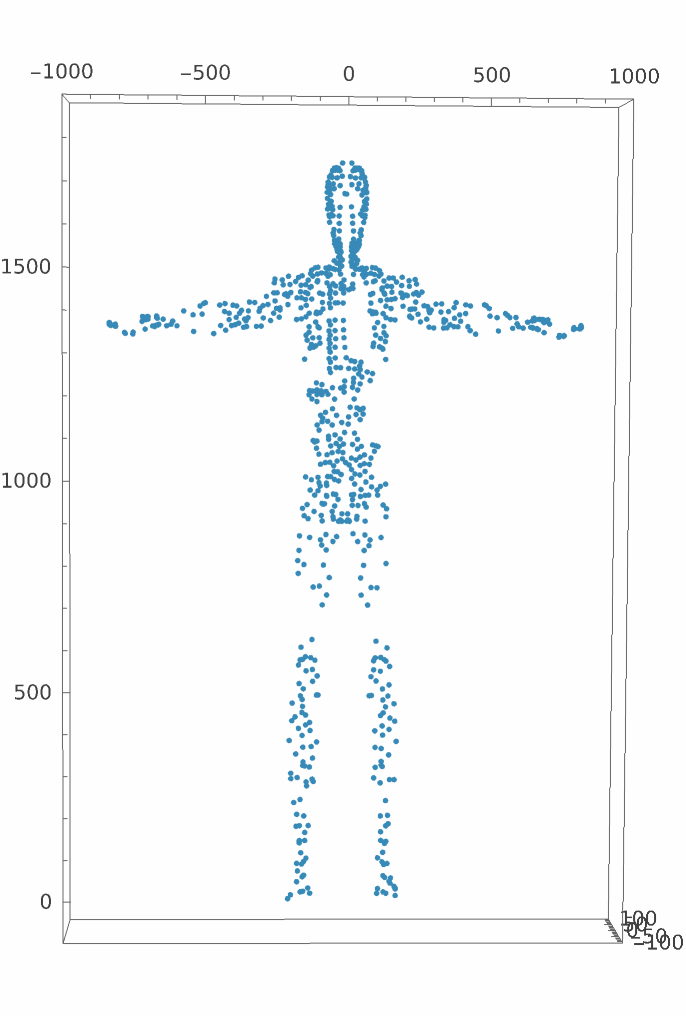 |
Visualize the subgraph of the human lymphatic network induced by lymphatic organs:
| In[4]:= | ![Graph3D[Subgraph[ResourceData[\!\(\*
TagBox["\"\<The Human Lymphatic System\>\"",
#& ,
BoxID -> "ResourceTag-The Human Lymphatic System-Input",
AutoDelete->True]\)], ResourceData[\!\(\*
TagBox["\"\<The Human Lymphatic System\>\"",
#& ,
BoxID -> "ResourceTag-The Human Lymphatic System-Input",
AutoDelete->True]\), "LymphNode"]], VertexCoordinates -> ResourceData[\!\(\*
TagBox["\"\<The Human Lymphatic System\>\"",
#& ,
BoxID -> "ResourceTag-The Human Lymphatic System-Input",
AutoDelete->True]\), "Position"], Sequence[
EdgeStyle -> Directive[Gray,
Thickness[0.001]], VertexSize -> 1.3]]](https://www.wolframcloud.com/obj/resourcesystem/images/63e/63e705c2-bcc6-4458-959d-bd5f8baafd30/39c5194ea0d3bea2.png) |
| Out[4]= | 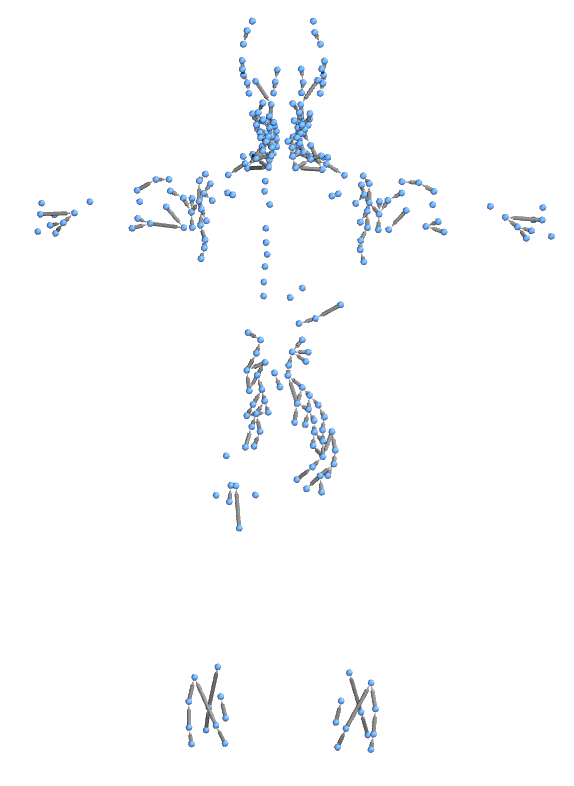 |
Retrieve and visualize the lymphatic network with a different GraphLayout, using customized vertex styles, sizes, and edge styles:
| In[5]:= | ![Graph[ResourceData[\!\(\*
TagBox["\"\<The Human Lymphatic System\>\"",
#& ,
BoxID -> "ResourceTag-The Human Lymphatic System-Input",
AutoDelete->True]\)], GraphLayout -> "GravityEmbedding", VertexStyle -> Black, VertexSize -> .2, EdgeStyle -> Gray, EdgeShapeFunction -> "Line"]](https://www.wolframcloud.com/obj/resourcesystem/images/63e/63e705c2-bcc6-4458-959d-bd5f8baafd30/03d8ec4b768e0ca1.png) |
| Out[5]= | 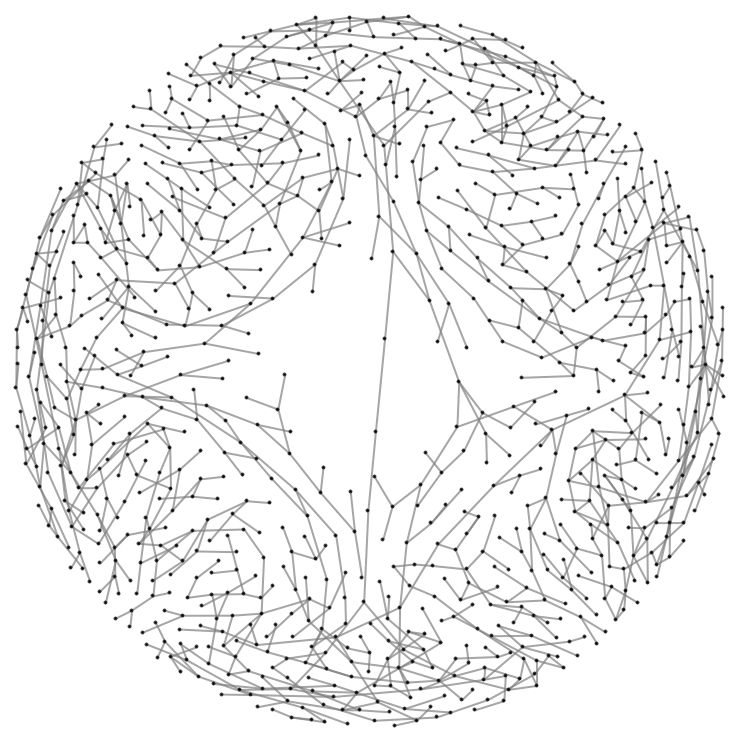 |
Retrieve and visualize the lymphatic network using anatomically accurate coordinates, highlighting lymphatic nodes in orange:
| In[6]:= | ![Graph3D[ResourceData[\!\(\*
TagBox["\"\<The Human Lymphatic System\>\"",
#& ,
BoxID -> "ResourceTag-The Human Lymphatic System-Input",
AutoDelete->True]\)], VertexCoordinates -> ResourceData[\!\(\*
TagBox["\"\<The Human Lymphatic System\>\"",
#& ,
BoxID -> "ResourceTag-The Human Lymphatic System-Input",
AutoDelete->True]\), "Position"], Sequence[
EdgeShapeFunction -> "Line", EdgeStyle -> Directive[Gray,
Thickness[0.001]], VertexSize -> 250], VertexStyle -> (Thread[ResourceData[\!\(\*
TagBox["\"\<The Human Lymphatic System\>\"",
#& ,
BoxID -> "ResourceTag-The Human Lymphatic System-Input",
AutoDelete->True]\), "LymphNode"] -> Orange])]](https://www.wolframcloud.com/obj/resourcesystem/images/63e/63e705c2-bcc6-4458-959d-bd5f8baafd30/5c41aaa595db07cd.png) |
| Out[6]= | 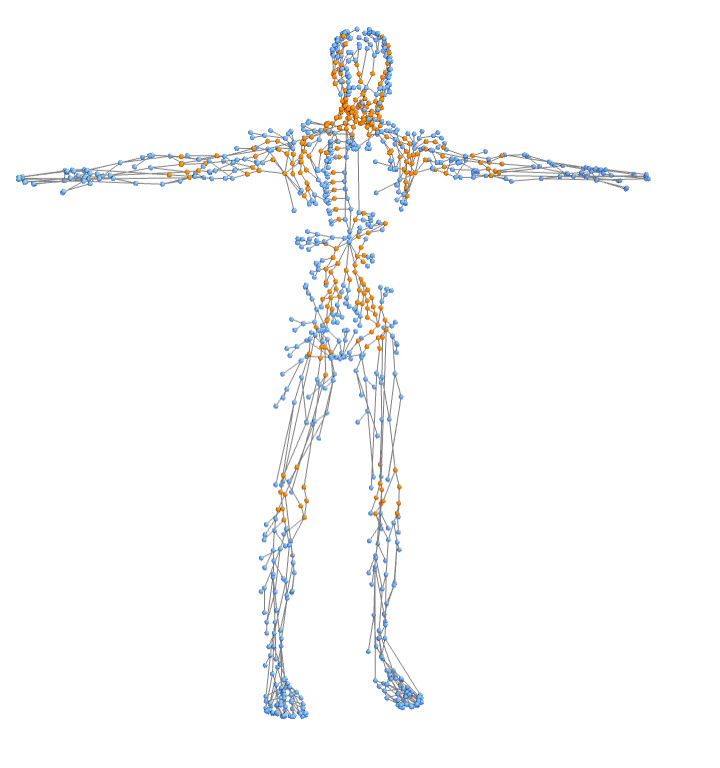 |
Visualize the degree centrality in the lymphatic network, reflecting the number of direct connections each node has to its neighbors:
| In[7]:= | ![With[{data = ResourceData[\!\(\*
TagBox["\"\<The Human Lymphatic System\>\"",
#& ,
BoxID -> "ResourceTag-The Human Lymphatic System-Input",
AutoDelete->True]\)]}, Graph3D[data, VertexCoordinates -> ResourceData[\!\(\*
TagBox["\"\<The Human Lymphatic System\>\"",
#& ,
BoxID -> "ResourceTag-The Human Lymphatic System-Input",
AutoDelete->True]\), "Position"], Sequence[
EdgeShapeFunction -> "Line", EdgeStyle -> Directive[Gray,
Thickness[0.001]], VertexSize -> 350], VertexStyle -> (Thread[
VertexList[
data] -> (ColorData[
"TemperatureMap"][#] & /@ (Rescale[<|{"ResourceType" -> "Data", "NotebookObject" -> NotebookObject[
"b918dcda-fe77-42cf-92e3-eaaa6cadcbf4", "19961687-df1a-40bf-882d-ee176a8dcf1a"], "Preflight" -> {},
"Name" -> "The Human Lymphatic System", "Description" -> "A three-dimensional graph where lymphatic organs and junctions are modeled as nodes and lymphatic vessels as edges"}|>, {
Min[
DegreeCentrality[data]],
Max[
DegreeCentrality[data]]}, {0, 1}] & /@ (DegreeCentrality[data] // N)))])]]](https://www.wolframcloud.com/obj/resourcesystem/images/63e/63e705c2-bcc6-4458-959d-bd5f8baafd30/6d6776101c30f6a1.png) |
| Out[7]= | 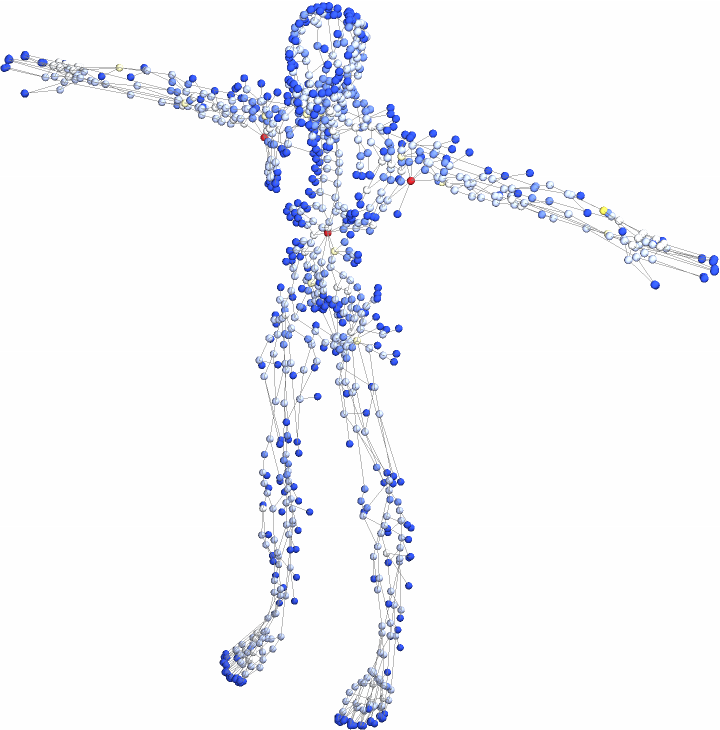 |
Visualize the hub nodes in the lymphatic network, indicating areas of high local connectivity and potential importance for local transport or spread:
| In[8]:= | ![Graph3D[ResourceData[\!\(\*
TagBox["\"\<The Human Lymphatic System\>\"",
#& ,
BoxID -> "ResourceTag-The Human Lymphatic System-Input",
AutoDelete->True]\)], VertexCoordinates -> ResourceData[\!\(\*
TagBox["\"\<The Human Lymphatic System\>\"",
#& ,
BoxID -> "ResourceTag-The Human Lymphatic System-Input",
AutoDelete->True]\), "Position"], Sequence[
EdgeShapeFunction -> "Line", EdgeStyle -> Directive[Gray,
Thickness[0.001]], VertexSize -> 350], VertexStyle -> (Thread[GraphHub[ResourceData[\!\(\*
TagBox["\"\<The Human Lymphatic System\>\"",
#& ,
BoxID -> "ResourceTag-The Human Lymphatic System-Input",
AutoDelete->True]\)]] -> Red])]](https://www.wolframcloud.com/obj/resourcesystem/images/63e/63e705c2-bcc6-4458-959d-bd5f8baafd30/2e505d0e2d59ab1e.png) |
| Out[8]= | 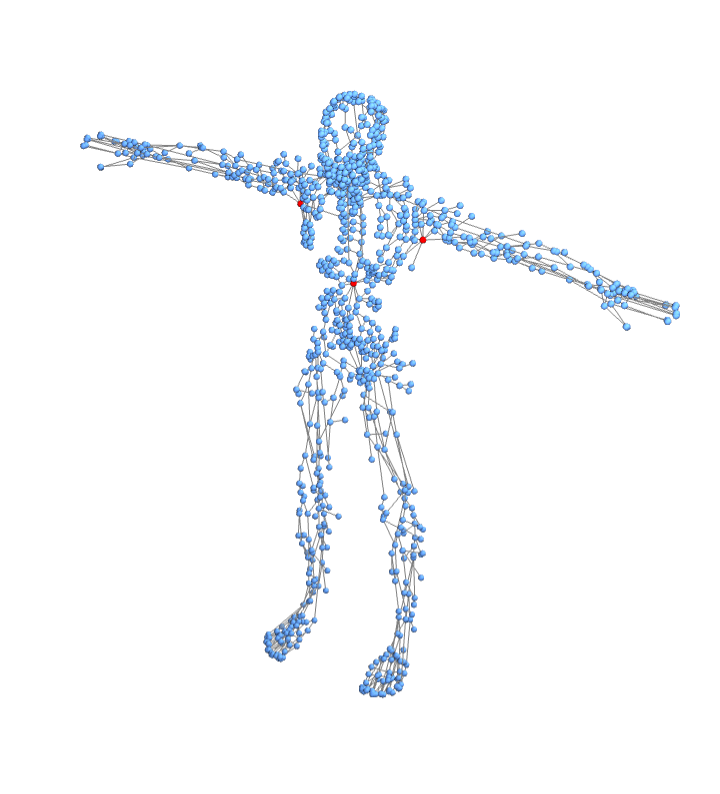 |
Visualize the betweenness centrality in the lymphatic network, quantifying how often a node lies on the shortest paths between other nodes and highlighting nodes that act as bridges within the network:
| In[9]:= | ![With[{data = ResourceData[\!\(\*
TagBox["\"\<The Human Lymphatic System\>\"",
#& ,
BoxID -> "ResourceTag-The Human Lymphatic System-Input",
AutoDelete->True]\)]}, Graph3D[data, VertexCoordinates -> ResourceData[\!\(\*
TagBox["\"\<The Human Lymphatic System\>\"",
#& ,
BoxID -> "ResourceTag-The Human Lymphatic System-Input",
AutoDelete->True]\), "Position"], Sequence[
EdgeShapeFunction -> "Line", EdgeStyle -> Directive[Gray,
Thickness[0.001]], VertexSize -> 350], VertexStyle -> (Thread[
VertexList[
data] -> (ColorData[
"TemperatureMap"][#] & /@ (Rescale[<|{"ResourceType" -> "Data", "NotebookObject" -> NotebookObject[
"b918dcda-fe77-42cf-92e3-eaaa6cadcbf4", "19961687-df1a-40bf-882d-ee176a8dcf1a"], "Preflight" -> {},
"Name" -> "The Human Lymphatic System", "Description" -> "A three-dimensional graph where lymphatic organs and junctions are modeled as nodes and lymphatic vessels as edges"}|>, {
Min[
BetweennessCentrality[data]],
Max[
BetweennessCentrality[data]]}, {0, 1}] & /@ (BetweennessCentrality[data] // N)))])]]](https://www.wolframcloud.com/obj/resourcesystem/images/63e/63e705c2-bcc6-4458-959d-bd5f8baafd30/1918c131dd586d23.png) |
| Out[9]= | 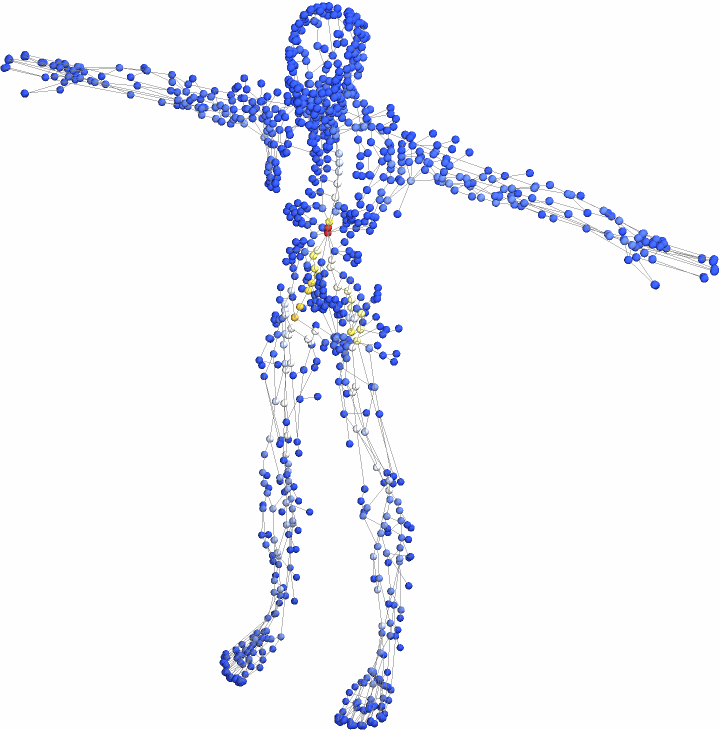 |
Visualize graph communities within the lymphatic network using a hierarchical community detection method:
| In[10]:= | ![g = Graph3D[ResourceData[\!\(\*
TagBox["\"\<The Human Lymphatic System\>\"",
#& ,
BoxID -> "ResourceTag-The Human Lymphatic System-Input",
AutoDelete->True]\)], VertexCoordinates -> ResourceData[\!\(\*
TagBox["\"\<The Human Lymphatic System\>\"",
#& ,
BoxID -> "ResourceTag-The Human Lymphatic System-Input",
AutoDelete->True]\), "Position"], Sequence[
EdgeShapeFunction -> "Line", EdgeStyle -> Directive[Gray,
Thickness[0.001]], VertexSize -> 350]];](https://www.wolframcloud.com/obj/resourcesystem/images/63e/63e705c2-bcc6-4458-959d-bd5f8baafd30/0574840425cfe0ce.png) |
| In[11]:= | ![HighlightGraph[g, Map[Subgraph[g, #] &, FindGraphCommunities[ResourceData[\!\(\*
TagBox["\"\<The Human Lymphatic System\>\"",
#& ,
BoxID -> "ResourceTag-The Human Lymphatic System-Input",
AutoDelete->True]\)], Method -> "Hierarchical"]]]](https://www.wolframcloud.com/obj/resourcesystem/images/63e/63e705c2-bcc6-4458-959d-bd5f8baafd30/66f7795cca0dcd32.png) |
| Out[11]= | 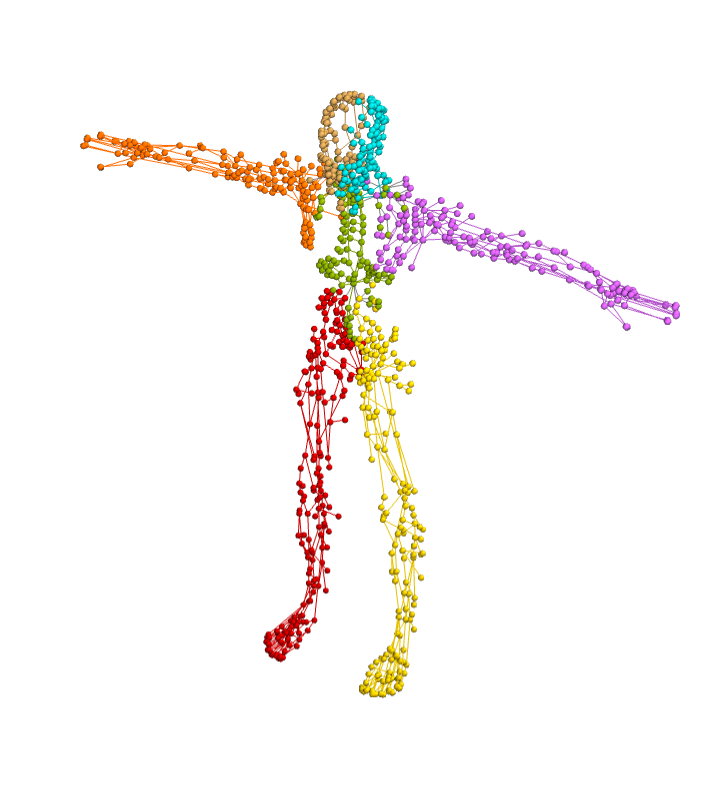 |
Visualize different graph partitions of the lymphatic network:
| In[12]:= | ![Table[HighlightGraph[g, Map[Subgraph[g, #] &, FindGraphPartition[ResourceData[\!\(\*
TagBox["\"\<The Human Lymphatic System\>\"",
#& ,
BoxID -> "ResourceTag-The Human Lymphatic System-Input",
AutoDelete->True]\)], i]], PlotLabel -> i], {i, 2, 7}]](https://www.wolframcloud.com/obj/resourcesystem/images/63e/63e705c2-bcc6-4458-959d-bd5f8baafd30/758c40003cbfdb63.png) |
| Out[12]= | 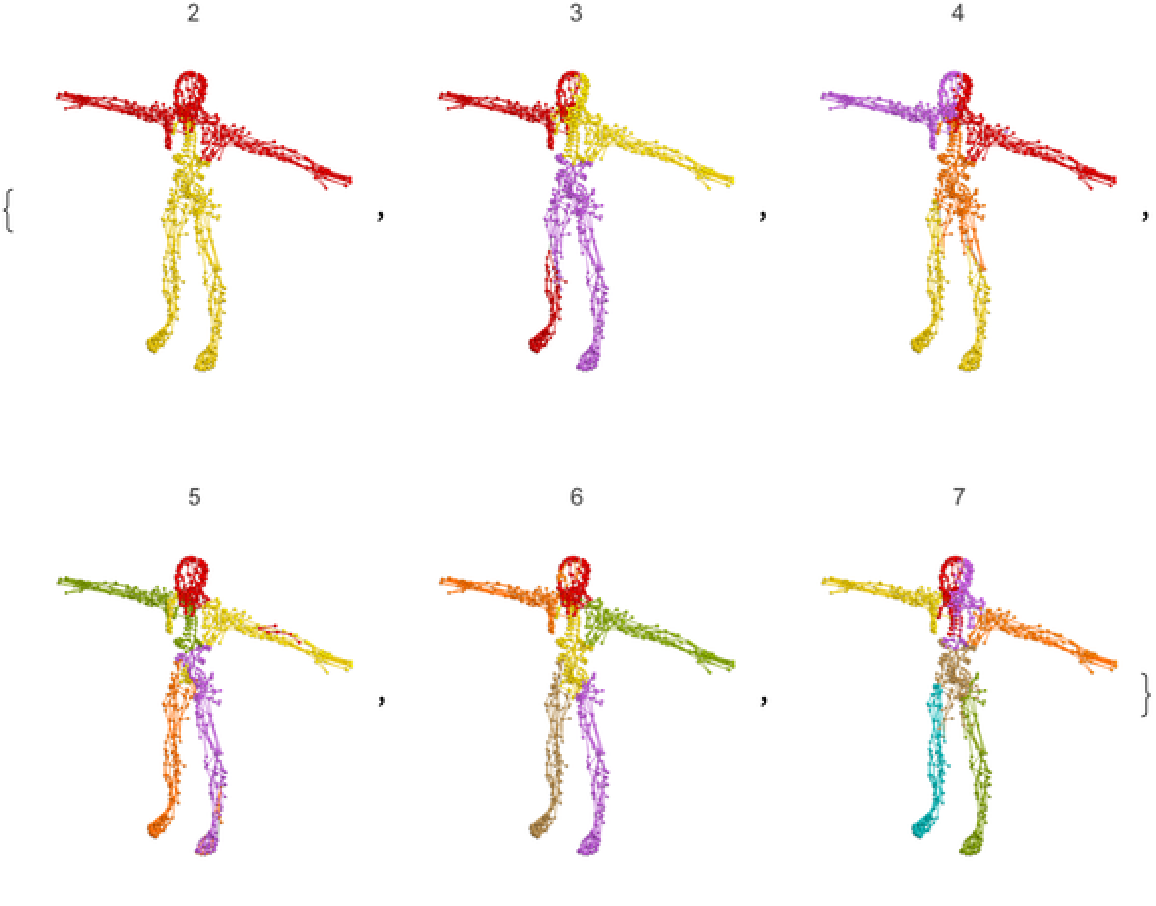 |
Wolfram Discrete Computation, "The Human Lymphatic System" from the Wolfram Data Repository (2026)