Wolfram Data Repository
Immediate Computable Access to Curated Contributed Data
Formaldehyde concentration analysis
Originator: Carl A. Bennett and Norman L. Franklin
(2 columns, 6 rows)
Retrieve the ResourceObject:
| In[1]:= |
| Out[1]= | 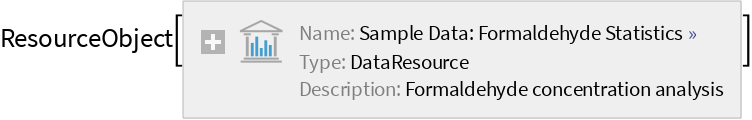 |
View the data:
| In[2]:= |
| Out[2]= | 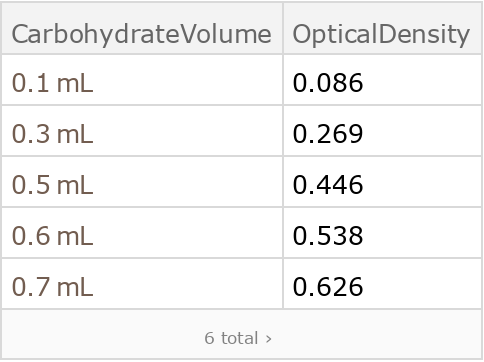 |
Generate a plot of the carbohydrate volume in mL by optical density of formaldehyde:
| In[3]:= | ![ListPlot[ResourceData["Sample Data: Formaldehyde Statistics"][
All, {"CarbohydrateVolume", "OpticalDensity"}], PlotRange -> All, AxesLabel -> {"Volume (mL)", "Density"}]](https://www.wolframcloud.com/obj/resourcesystem/images/656/656a70a4-ec44-4ecf-a1f1-fd8806e063f9/22309546f6fa6e49.png) |
| Out[3]= | 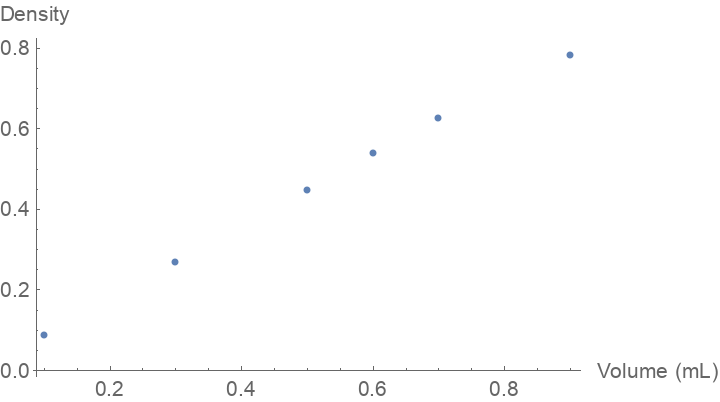 |
Wolfram Research, "Sample Data: Formaldehyde Statistics" from the Wolfram Data Repository (2016) https://doi.org/10.24097/wolfram.28126.data