Wolfram Data Repository
Immediate Computable Access to Curated Contributed Data
Death times of Kidney transplant patients
Originator: Klein and Moeschberger
(5 columns, 863 rows)
Retrieve the ResourceObject:
| In[1]:= |
| Out[1]= |  |
View the data:
| In[2]:= |
| Out[2]= | 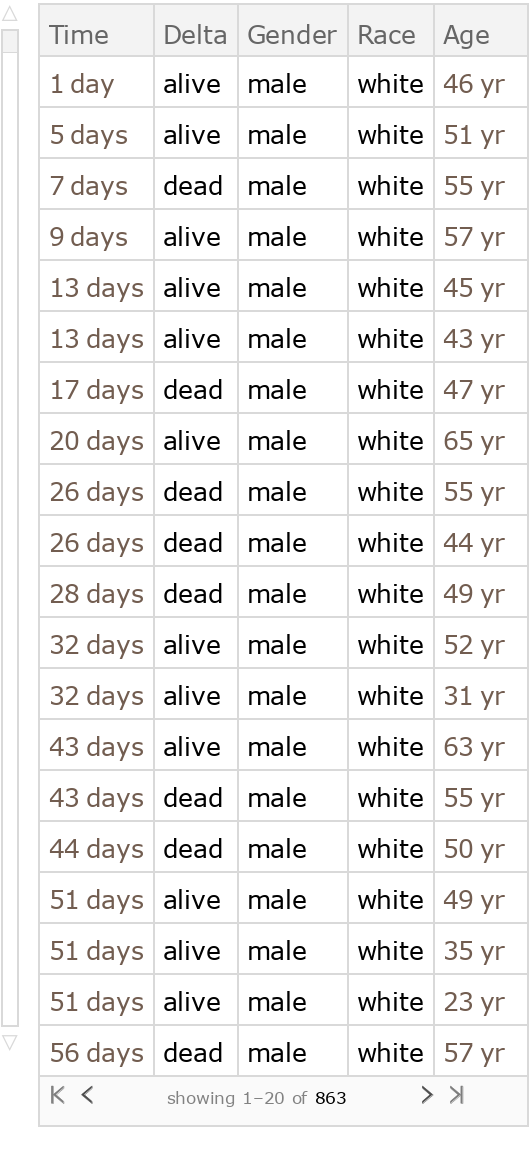 |
Generate a plot of the time the individual lived in days after the transplant to their age and differentiated by gender:
| In[3]:= |
| Out[3]= | 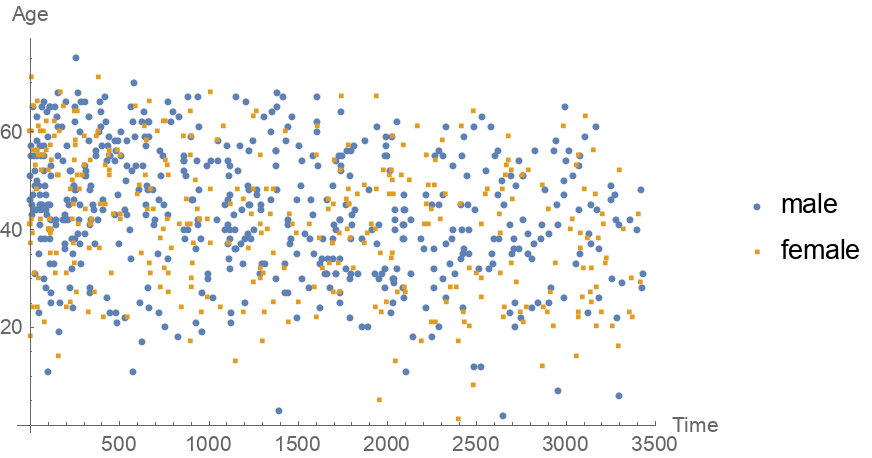 |
Wolfram Research, "Sample Data: Kidney Transplant" from the Wolfram Data Repository (2017) https://doi.org/10.24097/wolfram.84307.data