Wolfram Data Repository
Immediate Computable Access to Curated Contributed Data
Life-cycle savings hypothesis study
Originator: Arnie Sterling
(5 columns, 50 rows)
Retrieve the ResourceObject:
| In[1]:= |
| Out[1]= |  |
View the data:
| In[2]:= |
| Out[2]= | 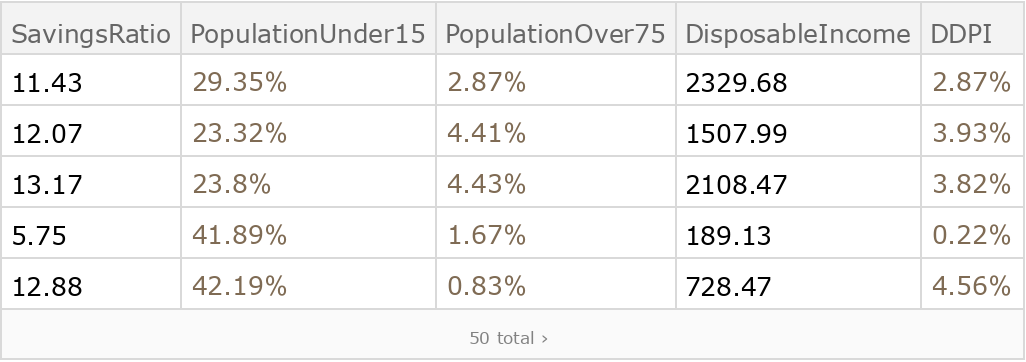 |
Generate a grid showing the disposable income by the percentages of the population under 15 years old and over 75 years old:
| In[3]:= | ![With[{under15 = ResourceData["Sample Data: Life Cycle Savings"][
All, {"DisposableIncome", "PopulationUnder15"}],
over75 = ResourceData["Sample Data: Life Cycle Savings"][
All, {"DisposableIncome", "PopulationOver75"}]},
ListPlot[{Values@Normal[under15], Values@Normal[over75]}, PlotRange -> All, PlotMarkers -> {Automatic, 7}, AxesLabel -> {"Disposable Income ($)", "Population (%)"}, PlotLegends -> {"Under 15", "Over 75"}]]](https://www.wolframcloud.com/obj/resourcesystem/images/6af/6af8abc8-b26f-4664-8e1d-6f4c6a09f1b8/4c00609beb05443a.png) |
| Out[3]= | 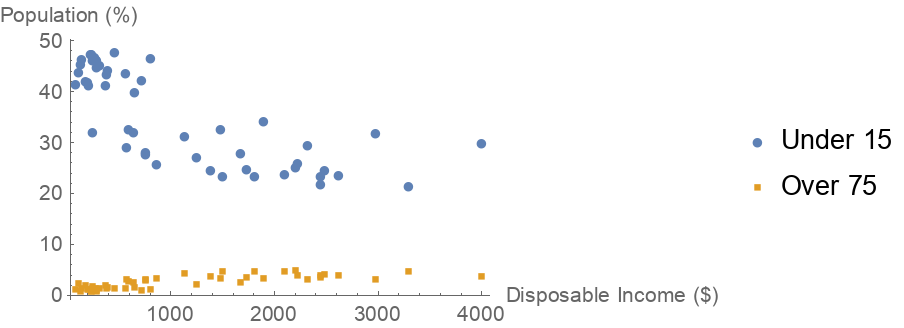 |
Wolfram Research, "Sample Data: Life Cycle Savings" from the Wolfram Data Repository (2016) https://doi.org/10.24097/wolfram.27206.data