Wolfram Data Repository
Immediate Computable Access to Curated Contributed Data
Atmospheric Convective Boundary Layer reflectivity in dBZ units measured with a near-vertical profiling 33.4 GHz radar
| ContactRate | radar range gates with contacts with greater than 2 dB SNR |
| TimeOfSolarNoon | time of solar noon (UST) |
| Day1To365 | day of recording |
| SolarRadiation | time history of clear day solar radiation in W/m2 |
| DBZMinMax | range of dBZ values in each image |
(4 elements)
Retrieve the data:
| In[1]:= |
| Out[1]= | 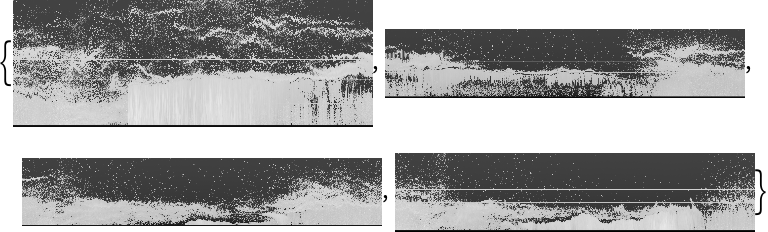 |
Get contact rates on the third day:
| In[2]:= |
| Out[3]= | 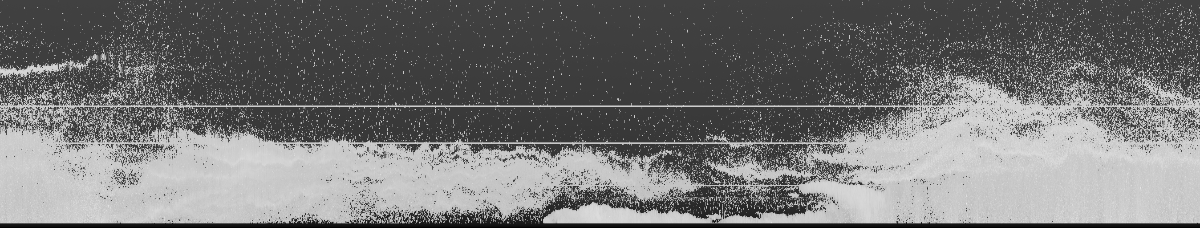 |
View the number of radar range gates with contacts as a function of universal standard time on day 3:
| In[4]:= | ![nday = 3;
contactRates = ResourceData[\!\(\*
TagBox["\"\<Clear Air Radar Reflections in the CBL\>\"",
#& ,
BoxID -> "ResourceTag-Clear Air Radar Reflections in the CBL-Input",
AutoDelete->True]\), "ContactRate"];
ListPlot[contactRates[[nday]], Sequence[
Axes -> False, Frame -> True, FrameLabel -> {"Universal Standard Time (hours)", "Range Gates with Contacts"}, AspectRatio -> 1, BaseStyle -> {FontSize -> 14}]]](https://www.wolframcloud.com/obj/resourcesystem/images/6d8/6d8b787c-57ba-4bf4-938d-b48f35ef780f/2ebd22dcd8c7f235.png) |
| Out[6]= | 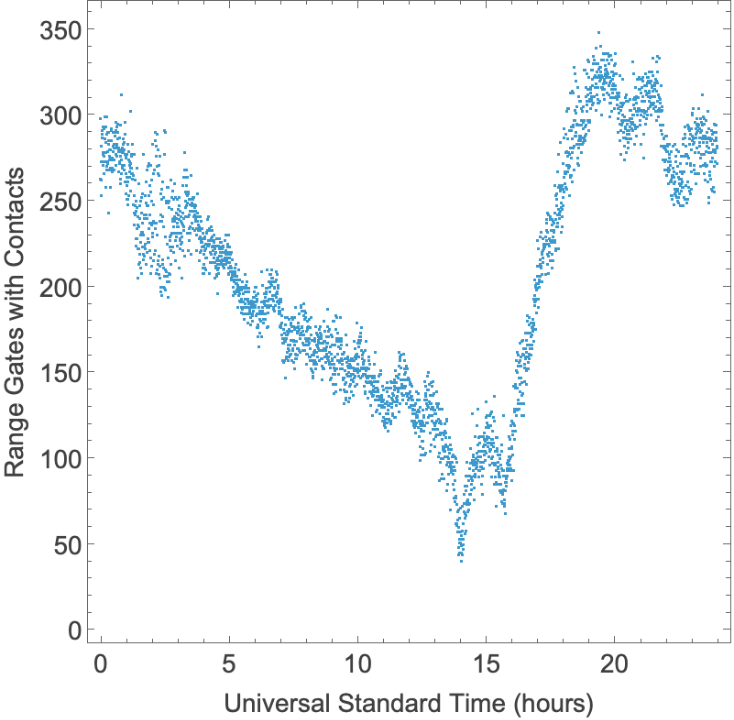 |
Compare the observed contact rates to solar radiation as a function of time. Solar radiation (smooth blue curve) has been estimated with a standard model and scaled for comparison purposes:
| In[7]:= | ![contactRates = ResourceData[\!\(\*
TagBox["\"\<Clear Air Radar Reflections in the CBL\>\"",
#& ,
BoxID -> "ResourceTag-Clear Air Radar Reflections in the CBL-Input",
AutoDelete->True]\), "ContactRate"];
sr = ResourceData[\!\(\*
TagBox["\"\<Clear Air Radar Reflections in the CBL\>\"",
#& ,
BoxID -> "ResourceTag-Clear Air Radar Reflections in the CBL-Input",
AutoDelete->True]\), "SolarRadiation"];
ListPlot[Join[contactRates, {0.5 sr}], Sequence[
PlotRange -> {{0, 24}, {-10, 550}}, Axes -> False, Frame -> True, FrameLabel -> {"Universal Standard Time (hours)", "Range Gates with Contacts"}, AspectRatio -> 1, ImageSize -> 500, BaseStyle -> {FontSize -> 14}, PlotLegends -> {"17 Feb", "18 Feb", "19 Feb", "20 Feb"}, Epilog -> {{
Dashing[0.01],
Line[{{17, 300}, {24, 300}}]},
Style[
Text["\!\(\*600 W/m^2\)", {15, 310}], FontSize -> 14]}]]](https://www.wolframcloud.com/obj/resourcesystem/images/6d8/6d8b787c-57ba-4bf4-938d-b48f35ef780f/715515ec7fd426f7.png) |
| Out[9]= | 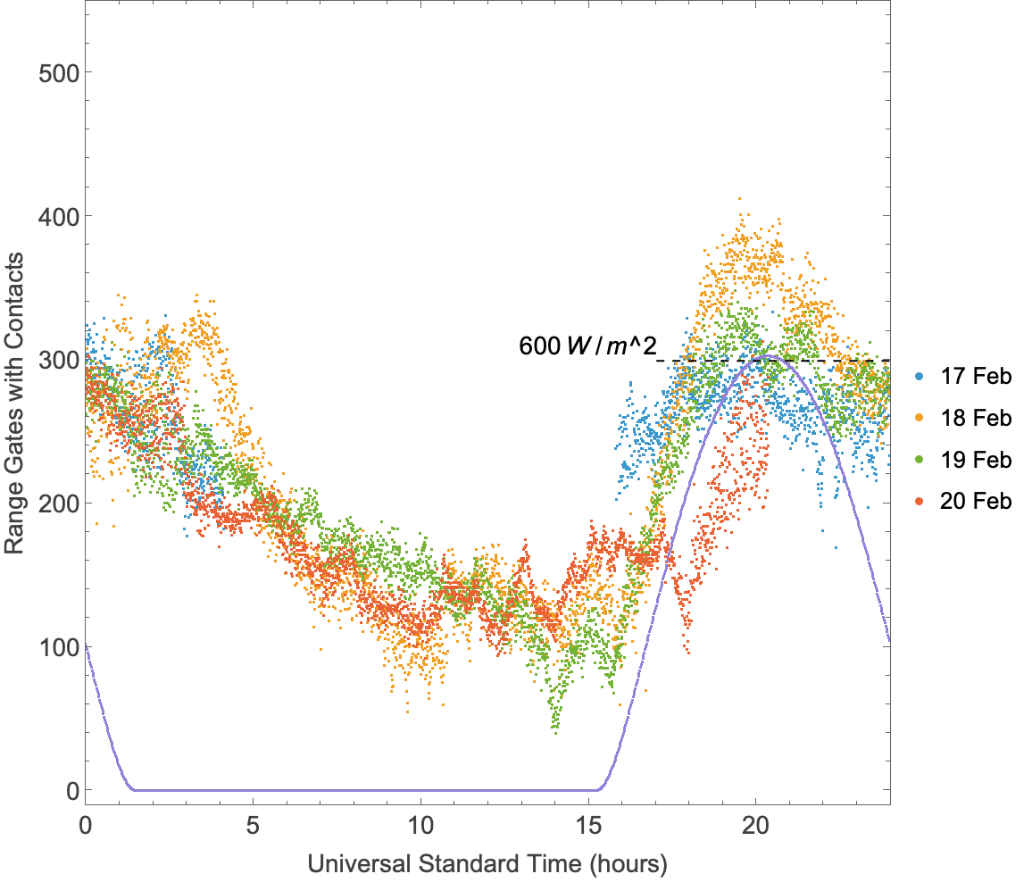 |
Convert an image to a dBZ scale and display. The color black corresponds to no reflectivity. The horizontal lines are radar signal processing artifacts:
| In[10]:= | ![nday = 3;
images = ResourceData[\!\(\*
TagBox["\"\<Clear Air Radar Reflections in the CBL\>\"",
#& ,
BoxID -> "ResourceTag-Clear Air Radar Reflections in the CBL-Input",
AutoDelete->True]\)];
{a, b} = ResourceData[\!\(\*
TagBox["\"\<Clear Air Radar Reflections in the CBL\>\"",
#& ,
BoxID -> "ResourceTag-Clear Air Radar Reflections in the CBL-Input",
AutoDelete->True]\), "DBZMinMax"][[nday]];
dbz = ImageData@ImageReflect[ImageApply[# (b - a) + a &, images[[nday]]]];
ReliefPlot[dbz, Sequence[
PlotRange -> {b - 50, b - 10}, FrameTicks -> True, DataRange -> {{0, 24}, (Sin[80 Degree] 3.125) {0, 512}}, AspectRatio -> 0.4, ImageSize -> 800, FrameLabel -> {"Universal Standard Time (hours)", "Altitude (m)"}, BaseStyle -> {FontSize -> 14}, PlotLegends -> BarLegend[Automatic, LegendLabel -> "dBZ"], ClippingStyle -> {Black, Yellow}]]](https://www.wolframcloud.com/obj/resourcesystem/images/6d8/6d8b787c-57ba-4bf4-938d-b48f35ef780f/2dee1710c12b8019.png) |
| Out[14]= | 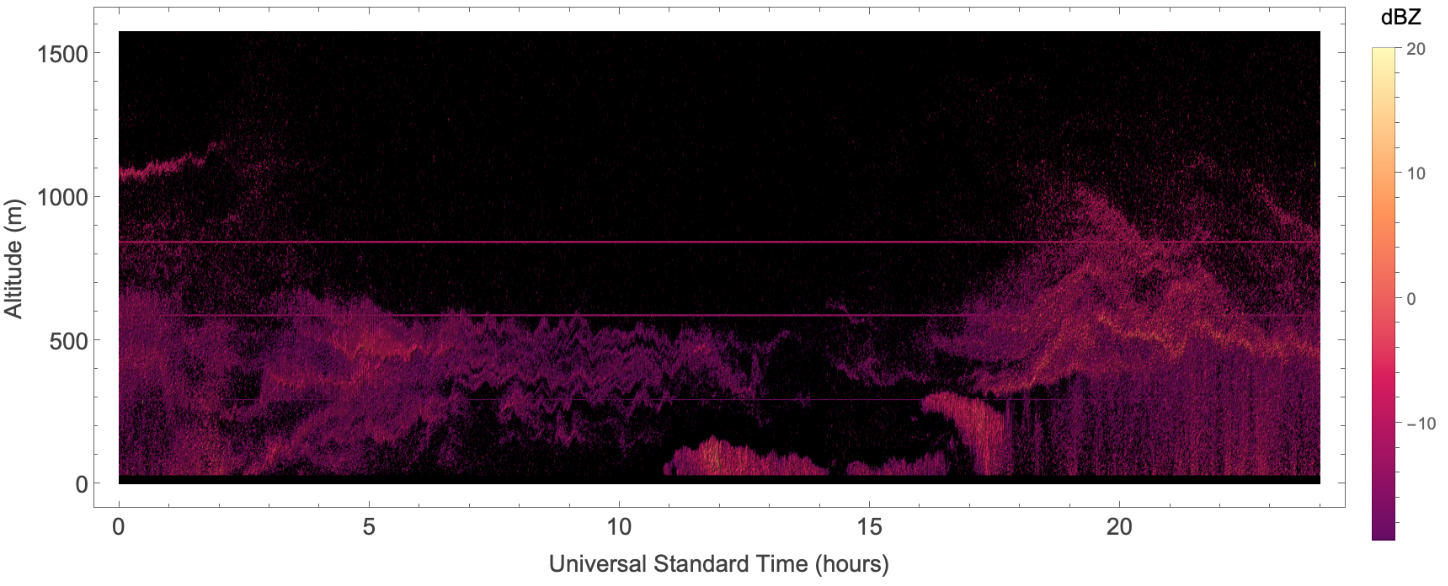 |
Marshall Bradley, "Clear Air Radar Reflections in the CBL" from the Wolfram Data Repository (2026)