Wolfram Data Repository
Immediate Computable Access to Curated Contributed Data
Dataset of elemental content in animals and plants
| "GeoPosition" | coordinates associated with the record |
| "Habitat" | aquatic or terrestrial biomes |
| "AquaticHabitat" | freshwater or marine biomes |
| "Kingdom" | kingdom level taxon |
| "Phylum" | phylum level taxon |
| "Class" | class level taxon |
| "Order" | order level taxon |
| "Family" | family level taxon |
| "Species" | species level taxon |
| "SpeciesLevelQ" | organisms identified at the species (True) or morphospecies (False) level |
| "TrophicGroup" | autotroph or heterotroph trophic groups |
| "FunctionalGroup" | autotroph, invertebrate, or vertebrate functional groups |
| "CarbonContent" | carbon content of organisms |
| "NitrogenContent" | nitrogen content of organisms |
| "PhosphorusContent" | phosphorus content of organisms |
| "CarbonNitrogenRatio" | carbon to nitrogen molar ratios of organisms |
| "CarbonPhosphorusRatio" | carbon to phosphorus molar ratios of organisms |
| "NitrogenPhosphateRatio" | nitrogen to phosphorus molar ratios of organisms |
| "CarbonNitrogenMassRatio" | carbon to nitrogen mass ratios of organisms |
| "CarbonPhosphorusMassRatio" | carbon to phosphorus mass ratios of organisms |
| "NitrogenPhosphateMassRatio" | nitrogen to phosphorus mass ratios of organisms |
| "BodyWeight" | body dry mass |
| "Temperature" | mean annual temperature at 10 meters above groud data from the National Aeronautics and Space Administration Prediction of Worldwide Energy Resources project (0.5° × 0.5° resolution) |
| "Radiation" | mean annual solar radiation data from the National Aeronautics and Space Administration Prediction of Worldwide Energy Resources project (1° × 1° resolution) |
| "NitrogenAvailability" | global nitrogen availability data from Ackerman et al., 2019 (2° × 2.5° resolution) |
| "SoilPhosphorus" | soil phosphorus labile data from the Oak Ridge National Laboratory Distributed Active Archive Center for Biogeochemical Dynamics (0.5° × 0.5° resolution) |
| "MarinePhosphorus" | marine phosphorus data from the National Center for Atmospheric Research World Ocean Atlas (1° × 1° resolution) |
| "Source" | references |
| "DataType" | type of data: either a published paper, a template, or database |
| "DataProvider" | persons who provided data |
Get a Dataset containing rows for each record of elemental content for an organism:
| In[1]:= |
| Out[1]= | 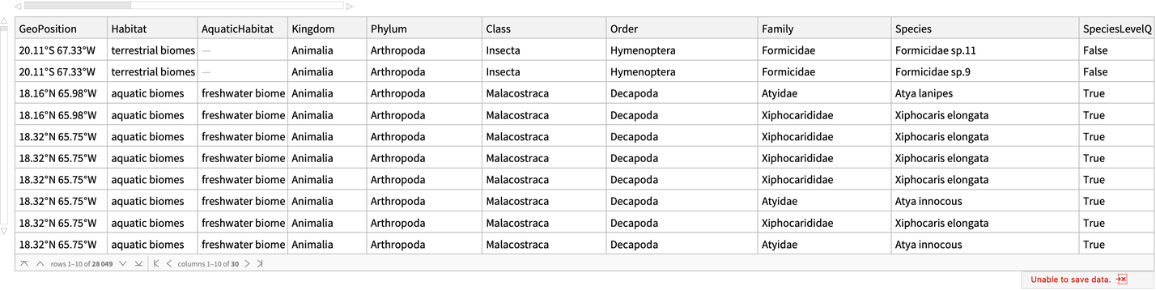 |
Map distribution of sampling locations in the dataset:
| In[2]:= | ![GeoHistogram[ResourceData[\!\(\*
TagBox["\"\<Elemental Content in Organisms\>\"",
#& ,
BoxID -> "ResourceTag-Elemental Content in Organisms-Input",
AutoDelete->True]\)][All, "GeoPosition"], 50, PlotLegends -> Automatic]](https://www.wolframcloud.com/obj/resourcesystem/images/7b8/7b86ca86-5f45-4b2b-8ae2-f2e6e823521d/5771f2f28d2aee5d.png) |
| Out[2]= | 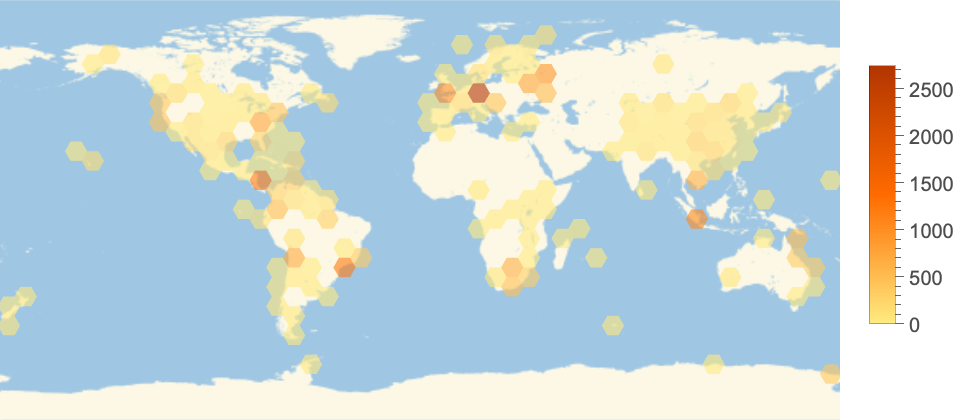 |
Compute distribution of elemental ratios by habitat and trophic group of organisms:
| In[3]:= | ![elementratiobybiome[biom_, elem_] := ResourceData[\!\(\*
TagBox["\"\<Elemental Content in Organisms\>\"",
#& ,
BoxID -> "ResourceTag-Elemental Content in Organisms-Input",
AutoDelete->True]\)][
Select[MatchQ[#Habitat, biom] || MatchQ[#AquaticHabitat, biom] &]][
GroupBy[#TrophicGroup &], All, elem]](https://www.wolframcloud.com/obj/resourcesystem/images/7b8/7b86ca86-5f45-4b2b-8ae2-f2e6e823521d/363478595132833e.png) |
| In[4]:= | ![GraphicsGrid[
Partition[
Append[Table[
DistributionChart[
Reverse@elementratiobybiome[#, {"CarbonNitrogenRatio", "CarbonPhosphorusRatio", "NitrogenPhosphateRatio"}[[
n]]] & /@ {EntityClass["Biome", "TerrestrialBiomes"], Entity["Biome", "MarineBiome"], Entity["Biome", "FreshwaterBiome"]}, PlotRange -> Automatic, PlotRangeClipping -> True, ChartLabels -> {{"terrestrial", "marine", "freshwater"}, None}, ChartStyle -> {Orange, Lighter[Blue]}, PlotTheme -> "Business", PlotLabel -> {"C:N ratio", "C:P ratio", "N:P ratio"}[[n]]], {n, 3}], SwatchLegend[{Orange, Lighter[Blue]}, {"autotroph", "heterotroph"}, LegendMarkerSize -> 25]], 2]]](https://www.wolframcloud.com/obj/resourcesystem/images/7b8/7b86ca86-5f45-4b2b-8ae2-f2e6e823521d/1df9bd9785d621ae.png) |
| Out[4]= | 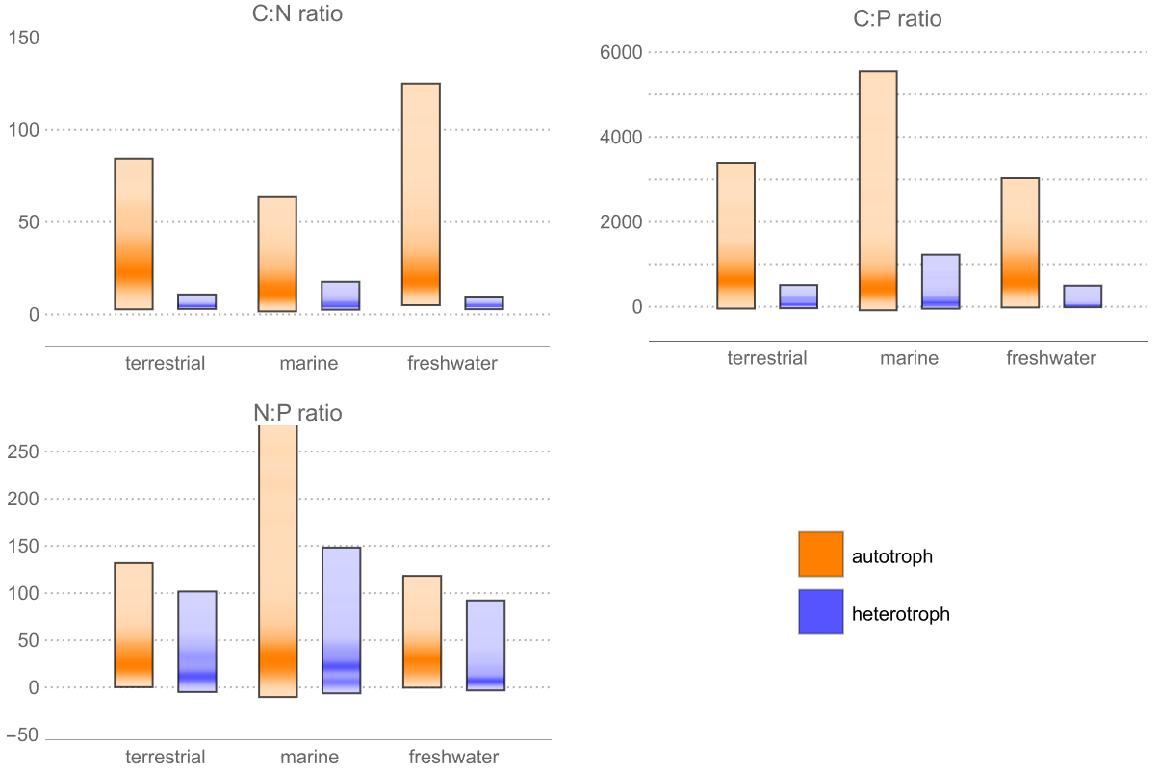 |
Retrieve elemental content by phylum:
| In[5]:= | ![elementcontentbyphylum = ResourceData[\!\(\*
TagBox["\"\<Elemental Content in Organisms\>\"",
#& ,
BoxID -> "ResourceTag-Elemental Content in Organisms-Input",
AutoDelete->True]\)][Select[! MissingQ[#Phylum] &]][GroupBy[#Phylum &],
All, {#CarbonContent, #NitrogenContent, #PhosphorusContent, #TrophicGroup} &][
All, <|"CarbonContent" -> DeleteMissing@#[[All, 1]], "NitrogenContent" -> DeleteMissing@#[[All, 2]], "PhosphorusContent" -> DeleteMissing@#[[All, 3]], "TrophicGroup" -> (Replace[
Union@#[[All, 4]], {s_String} :> s])|> /. {} -> Missing["NotAvailable"] &]](https://www.wolframcloud.com/obj/resourcesystem/images/7b8/7b86ca86-5f45-4b2b-8ae2-f2e6e823521d/156ad19d908fc584.png) |
| Out[5]= | 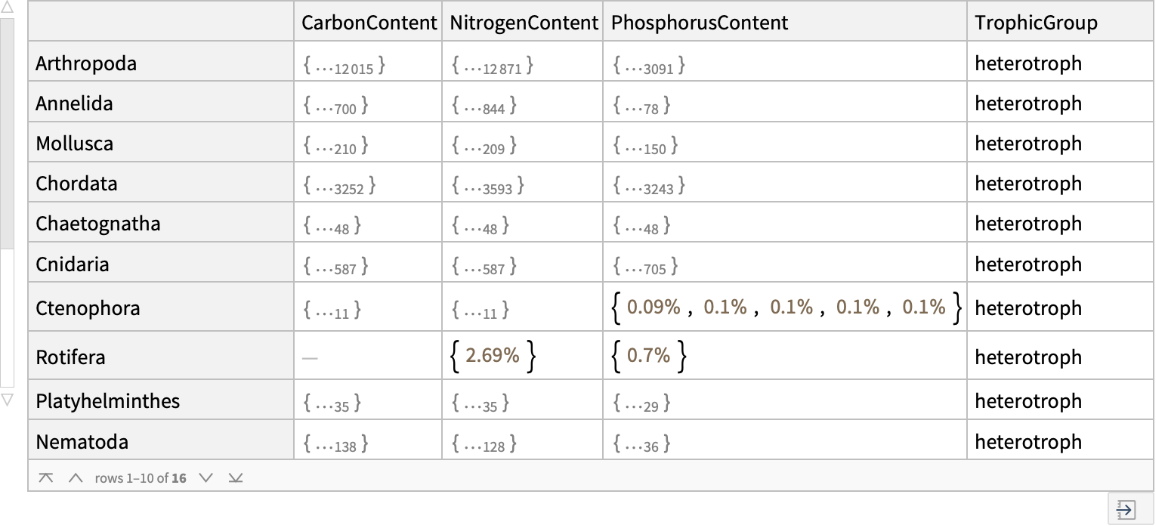 |
Compare distribution of elemental content by phylum and trophic group of organisms:
| In[6]:= | ![GraphicsGrid[
Partition[
Append[Table[
BoxWhiskerChart[
Join[Values@
Normal@elementcontentbyphylum[Select[! FreeQ[#, "autotroph"] &]][
All, Style[#[[n]], Orange] &], Values@Normal@
elementcontentbyphylum[Select[! FreeQ[#, "heterotroph"] &]][
All, Style[#[[n]], Lighter[Blue]] &]], PlotLabel -> {"carbon content (%)", "nitrogen content (%)", "phosphorus content (%)"}[[n]], ChartLabels -> (Normal@
Keys@Join[
elementcontentbyphylum[Select[! FreeQ[#, "autotroph"] &]], elementcontentbyphylum[
Select[! FreeQ[#, "heterotroph"] &]]] /. s_String :> Style[Rotate[s, Pi/2]])], {n, 1, 3}], SwatchLegend[{Orange, Lighter[Blue]}, {"autotroph", "heterotroph"},
LegendMarkerSize -> 25]], 2]]](https://www.wolframcloud.com/obj/resourcesystem/images/7b8/7b86ca86-5f45-4b2b-8ae2-f2e6e823521d/405c0dcd2211e47c.png) |
| Out[6]= | 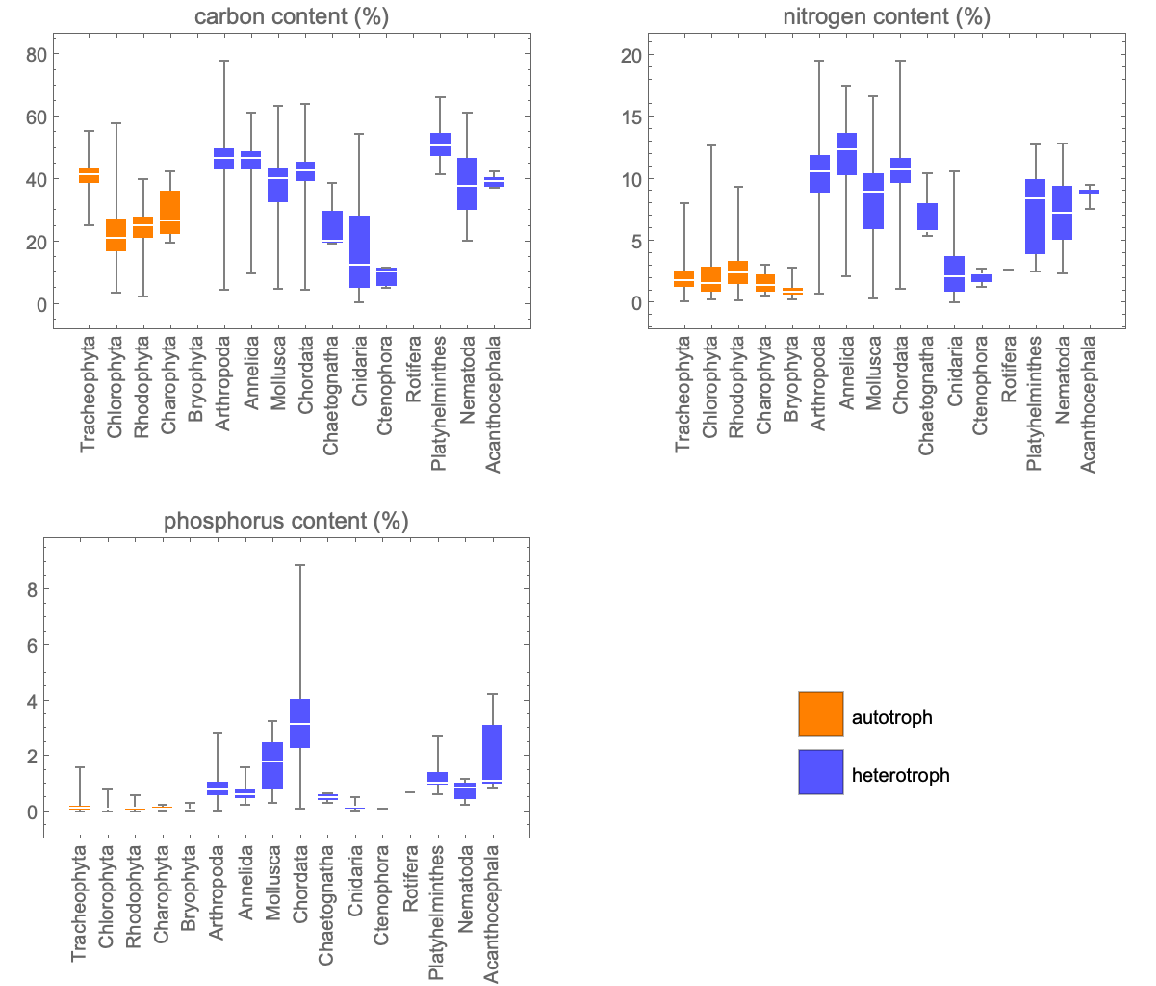 |
Wolfram Research, "Elemental Content in Organisms" from the Wolfram Data Repository (2025)