Wolfram Data Repository
Immediate Computable Access to Curated Contributed Data
Anscombe's 4 regression line data
These four datasets that have nearly identical simple descriptive statistics, yet appear very different when graphed. Each dataset consists of eleven (x,y) points. They were constructed in 1973 by the statistician Francis Anscombe to demonstrate both the importance of graphing data before analyzing it and the effect of outliers on statistical properties.
(8 columns, 11 rows)
Retrieve the ResourceObject:
| In[1]:= |
| Out[1]= | 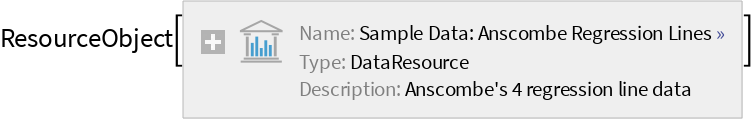 |
View the data:
| In[2]:= |
| Out[2]= | 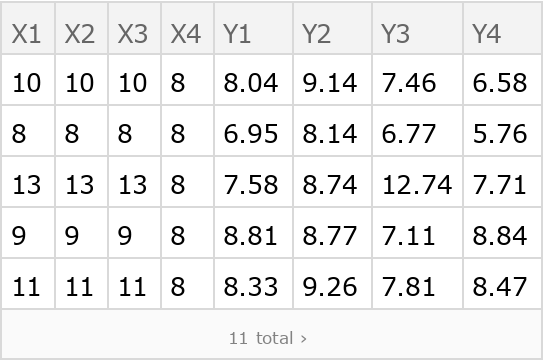 |
Plot the four datasets with linear regression line:
| In[3]:= | ![Show[Plot[3 + 0.5 x, {x, 2, 16}], #] & /@ ListPlot /@ (ResourceData["Sample Data: Anscombe Regression Lines"][
All, #] & /@ {{"X1", "Y1"}, {"X2", "Y2"}, {"X3", "Y3"}, {"X4", "Y4"}})](https://www.wolframcloud.com/obj/resourcesystem/images/85b/85bc91ff-57f4-45d4-bf0a-24124007f8b6/35be6af6e8c0e1de.png) |
| Out[3]= | 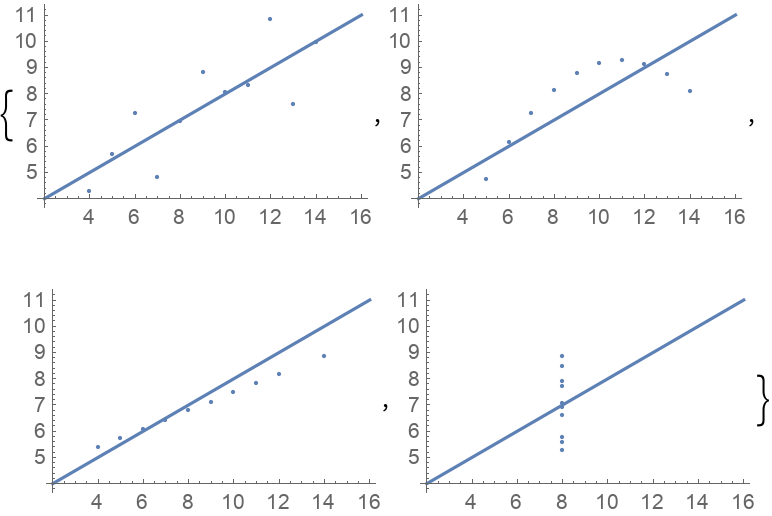 |
Wolfram Research, "Sample Data: Anscombe Regression Lines" from the Wolfram Data Repository (2016) https://doi.org/10.24097/wolfram.70071.data