Wolfram Data Repository
Immediate Computable Access to Curated Contributed Data
Timeseries of Consumer Price Indices in Australia from 1948 to 2020
(8 elements)
Retrieve CPI time series on Food and beverages for Sydney area:
| In[1]:= | ![Query[Entity["City", {"Sydney", "NewSouthWales", "Australia"}], "Food and non-alcoholic beverages", "Consumer Price Index"][
ResourceData[\!\(\*
TagBox["\"\<Australian Consumer Price Indices: from 1948 to 2020\>\"",
#& ,
BoxID -> "ResourceTag-Australian Consumer Price Indices: from 1948 to 2020-Input",
AutoDelete->True]\)]]](https://www.wolframcloud.com/obj/resourcesystem/images/4bd/4bd73362-7f07-4983-93c5-1bea64d8d0a7/4a9433f2654a411c.png) |
| Out[1]= | 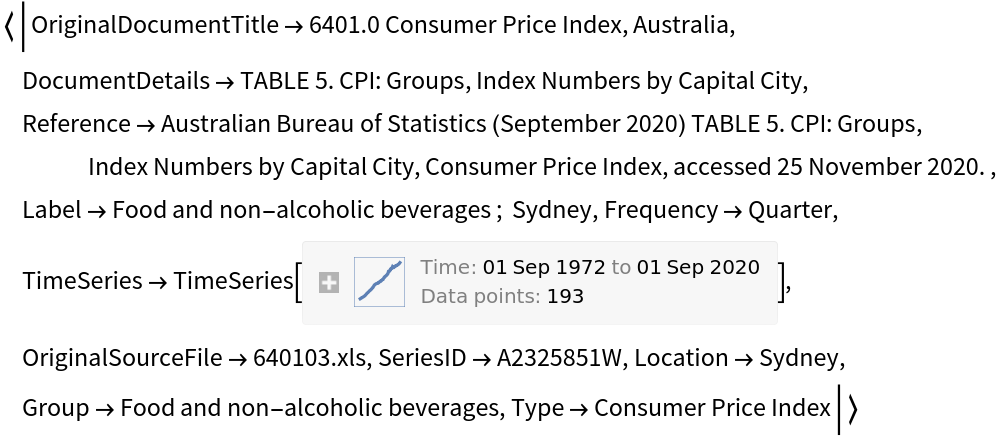 |
Retrieve the analytical series for all categories for all Australia:
| In[2]:= | ![Query[Entity["Country", "Australia"], "All", "Analytical Series"][
ResourceData[\!\(\*
TagBox["\"\<Australian Consumer Price Indices: from 1948 to 2020\>\"",
#& ,
BoxID -> "ResourceTag-Australian Consumer Price Indices: from 1948 to 2020-Input",
AutoDelete->True]\)]]](https://www.wolframcloud.com/obj/resourcesystem/images/4bd/4bd73362-7f07-4983-93c5-1bea64d8d0a7/7fa35e2d8824cfc9.png) |
| Out[2]= |  |
Get the original source file name for the analytical series for all categories for all Australia:
| In[3]:= | ![Query[Entity["Country", "Australia"], "All", "Analytical Series", "OriginalSourceFile"][ResourceData[\!\(\*
TagBox["\"\<Australian Consumer Price Indices: from 1948 to 2020\>\"",
#& ,
BoxID -> "ResourceTag-Australian Consumer Price Indices: from 1948 to 2020-Input",
AutoDelete->True]\)]]](https://www.wolframcloud.com/obj/resourcesystem/images/4bd/4bd73362-7f07-4983-93c5-1bea64d8d0a7/5f6530f4ef9b65f4.png) |
| Out[3]= |
Each data contains some display information. We can use the time series and label to display them in a DateListPlot:
| In[4]:= | ![DateListPlot[
Query[Entity["Country", "Australia"], "All", "Analytical Series", "TimeSeries"][ResourceData[\!\(\*
TagBox["\"\<Australian Consumer Price Indices: from 1948 to 2020\>\"",
#& ,
BoxID -> "ResourceTag-Australian Consumer Price Indices: from 1948 to 2020-Input",
AutoDelete->True]\)]],
PlotLabel -> Query[Entity["Country", "Australia"], "All", "Analytical Series", "Label"][ResourceData[\!\(\*
TagBox["\"\<Australian Consumer Price Indices: from 1948 to 2020\>\"",
#& ,
BoxID -> "ResourceTag-Australian Consumer Price Indices: from 1948 to 2020-Input",
AutoDelete->True]\)]],
Filling -> Bottom]](https://www.wolframcloud.com/obj/resourcesystem/images/4bd/4bd73362-7f07-4983-93c5-1bea64d8d0a7/09c3932d043de317.png) |
| Out[4]= | 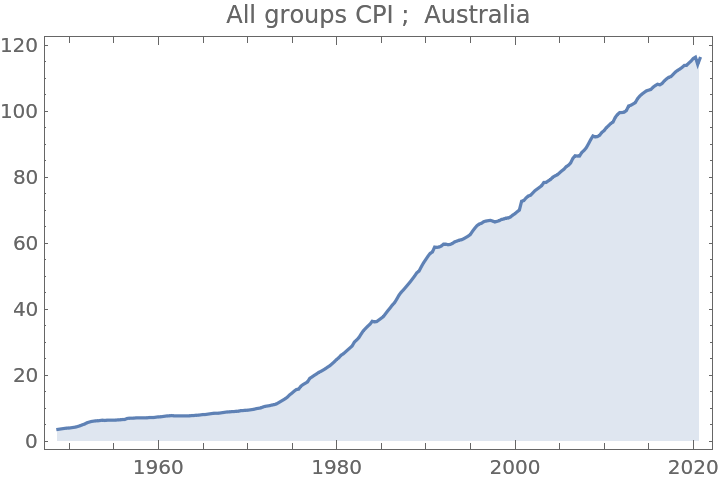 |
Filippo Visco-Comandini, "Australian Consumer Price Indices: from 1948 to 2020" from the Wolfram Data Repository (2021)