Examples
Basic Examples (3)
Retrieve the graph:
Find the vertex count for the network:
Find the edge count for the network:
Scope & Additional Elements (3)
Get the names of the first 100 stations:
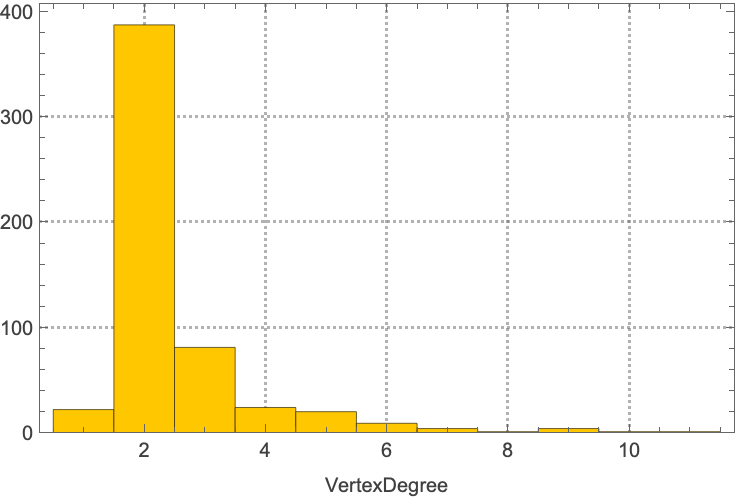
Visualize the histogram of the vertex degree of the graph:
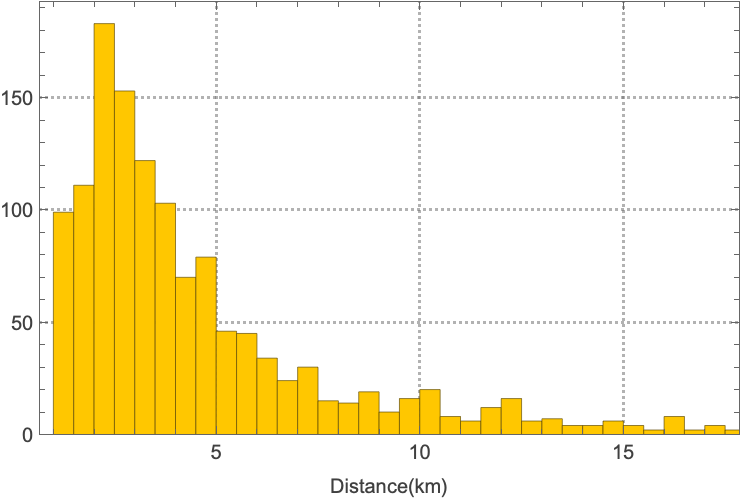
Visualize the histogram of the distance between stations:
Visualizations (2)
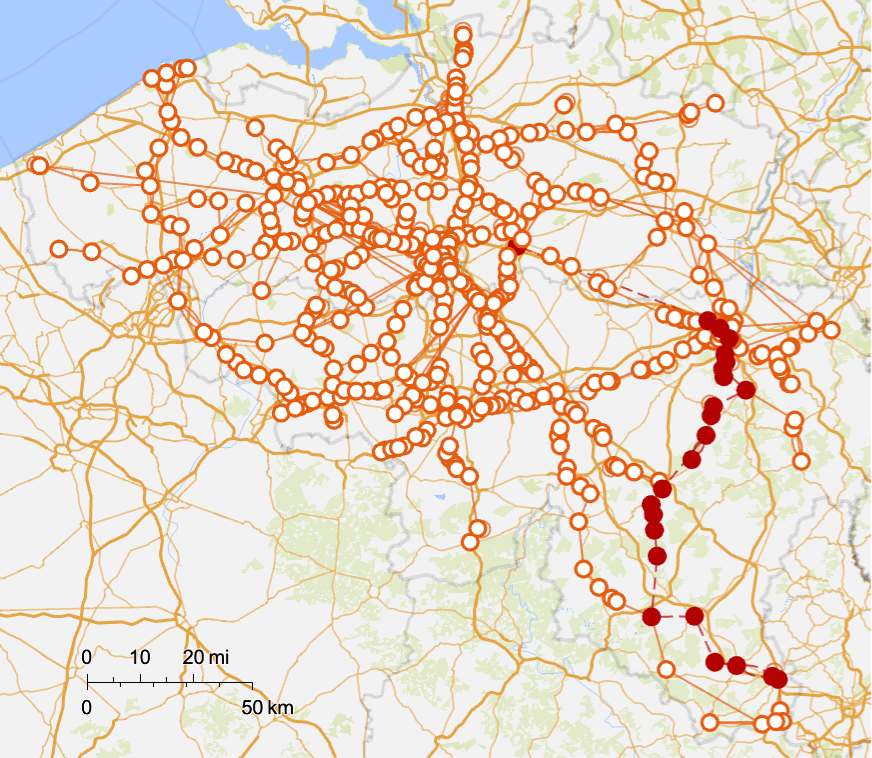
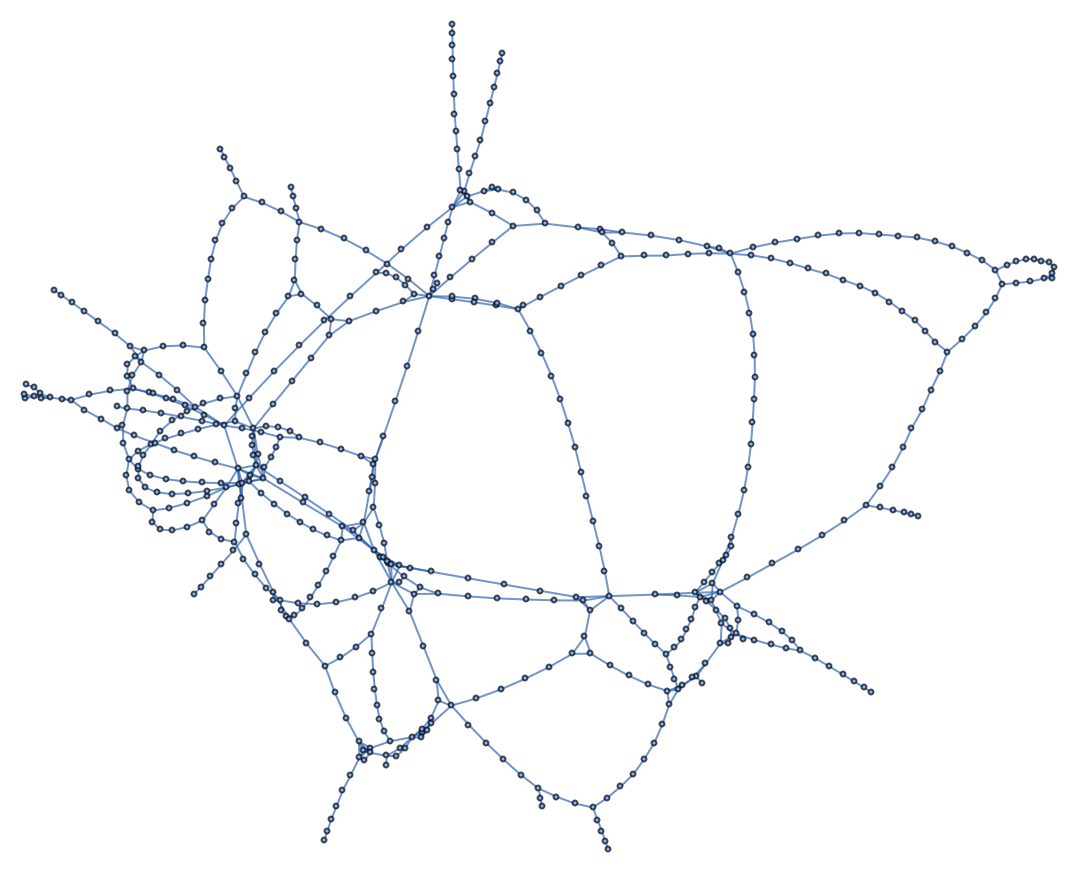
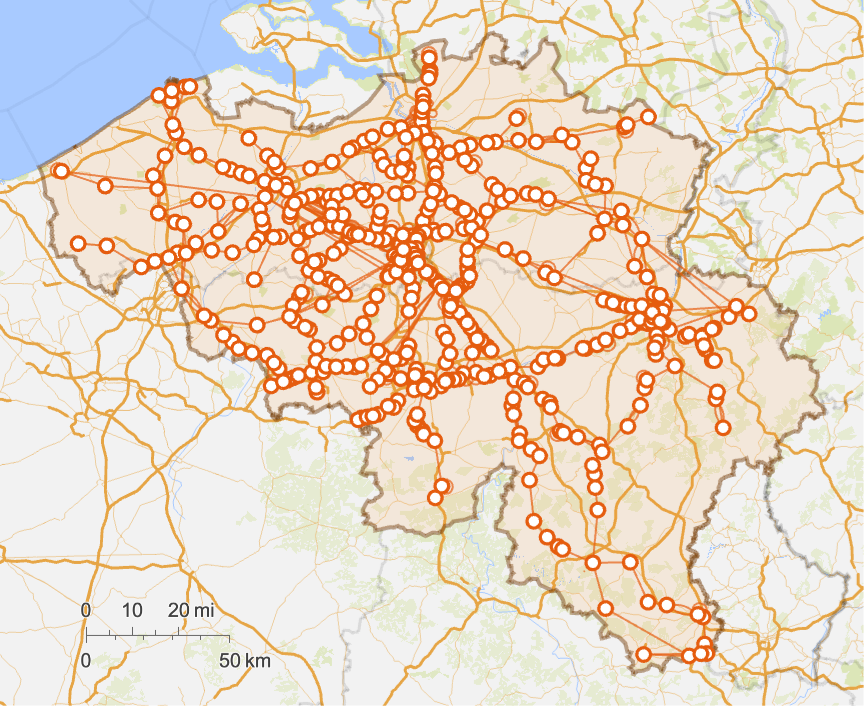
Visualize the full GeoGraphPlot:
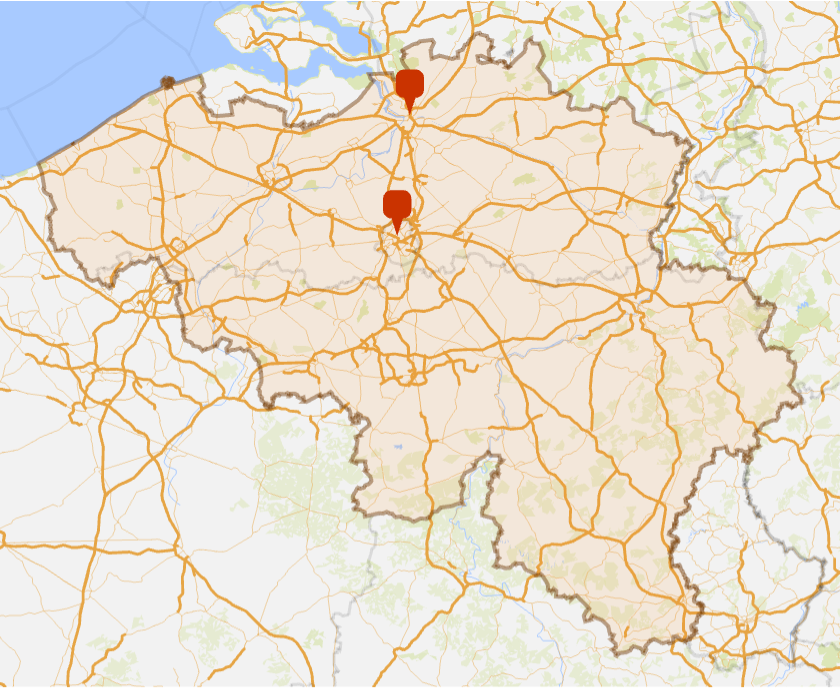
Visualize "ANTWERPEN-C" and "BRUXELLES-ND" stations:
Analysis (2)
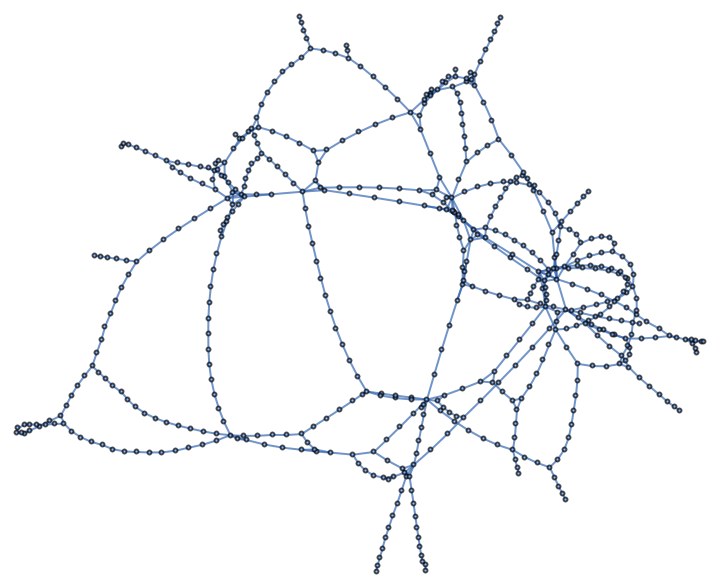
Generate the weighted graph:
Find the shortest path between two stations:
And visualize the path:
Bibliographic Citation
Wolfram Discrete Computation,
"Belgian Railway Network"
from the Wolfram Data Repository
(2026)
Data Resource History
See Also
Publisher Information

![Show[GeoListPlot[Entity["Country", "Belgium"], PlotStyle -> {
Directive[Orange, Dashed,
EdgeForm[{DarkOrange, Thick}],
Opacity[0.1]]}], GeoGraphPlot[ResourceData[\!\(\*
TagBox["\"\<Belgian Railway Network\>\"",
#& ,
BoxID -> "ResourceTag-Belgian Railway Network-Input",
AutoDelete->True]\)] /. ResourceData[\!\(\*
TagBox["\"\<Belgian Railway Network\>\"",
#& ,
BoxID -> "ResourceTag-Belgian Railway Network-Input",
AutoDelete->True]\), "Position"], PlotTheme -> "Scientific"]]](https://www.wolframcloud.com/obj/resourcesystem/images/f36/f3667087-2df9-432a-9a09-1572bd30acaf/3f90d0e8e5c01181.png)
![Show[GeoListPlot[Entity["Country", "Belgium"], PlotStyle -> {
Directive[Orange, Dashed,
EdgeForm[{DarkOrange, Thick}],
Opacity[0.1]]}], GeoListPlot[{"ANTWERPEN-C", "BRUXELLES-ND"} /. ResourceData[\!\(\*
TagBox["\"\<Belgian Railway Network\>\"",
#& ,
BoxID -> "ResourceTag-Belgian Railway Network-Input",
AutoDelete->True]\), "Position"], Sequence[
PlotStyle -> Directive[Black,
Opacity[1],
PointSize[10]], PlotMarkers -> GeoMarker]]]](https://www.wolframcloud.com/obj/resourcesystem/images/f36/f3667087-2df9-432a-9a09-1572bd30acaf/6f14a170a20057f7.png)
![g = Graph[ResourceData[\!\(\*
TagBox["\"\<Belgian Railway Network\>\"",
#& ,
BoxID -> "ResourceTag-Belgian Railway Network-Input",
AutoDelete->True]\)], EdgeWeight -> ResourceData[\!\(\*
TagBox["\"\<Belgian Railway Network\>\"",
#& ,
BoxID -> "ResourceTag-Belgian Railway Network-Input",
AutoDelete->True]\), "EdgeWeight"]];](https://www.wolframcloud.com/obj/resourcesystem/images/f36/f3667087-2df9-432a-9a09-1572bd30acaf/670c37c16e49d9de.png)

![GeoGraphPlot[HighlightGraph[Graph[ResourceData[\!\(\*
TagBox["\"\<Belgian Railway Network\>\"",
#& ,
BoxID -> "ResourceTag-Belgian Railway Network-Input",
AutoDelete->True]\)] /. ResourceData[\!\(\*
TagBox["\"\<Belgian Railway Network\>\"",
#& ,
BoxID -> "ResourceTag-Belgian Railway Network-Input",
AutoDelete->True]\), "Position"]], PathGraph[DeleteDuplicates[sp /. ResourceData[\!\(\*
TagBox["\"\<Belgian Railway Network\>\"",
#& ,
BoxID -> "ResourceTag-Belgian Railway Network-Input",
AutoDelete->True]\), "Position"]]]], PlotTheme -> "Scientific"]](https://www.wolframcloud.com/obj/resourcesystem/images/f36/f3667087-2df9-432a-9a09-1572bd30acaf/19e7d6c96f06eb0c.png)