Wolfram Data Repository
Immediate Computable Access to Curated Contributed Data
Projected hospital resource use based on COVID-19 deaths
Retrieve the data for one state:
| In[1]:= | ![ResourceData[
ResourceObject["COVID-19 Hospital Resource Use Projections"]][\!\(\*
NamespaceBox["LinguisticAssistant",
DynamicModuleBox[{Typeset`query$$ = "louisiana", Typeset`boxes$$ = TemplateBox[{"\"Louisiana, United States\"",
RowBox[{"Entity", "[",
RowBox[{"\"AdministrativeDivision\"", ",",
RowBox[{"{",
RowBox[{"\"Louisiana\"", ",", "\"UnitedStates\""}], "}"}]}], "]"}], "\"Entity[\\\"AdministrativeDivision\\\", {\\\"Louisiana\\\", \
\\\"UnitedStates\\\"}]\"", "\"administrative division\""}, "Entity"], Typeset`allassumptions$$ = {{
"type" -> "Clash", "word" -> "louisiana", "template" -> "Assuming \"${word}\" is ${desc1}. Use as \
${desc2} instead", "count" -> "5", "Values" -> {{
"name" -> "USState", "desc" -> "a US state", "input" -> "*C.louisiana-_*USState-"}, {
"name" -> "Word", "desc" -> "a word", "input" -> "*C.louisiana-_*Word-"}, {
"name" -> "GivenName", "desc" -> "a given name", "input" -> "*C.louisiana-_*GivenName-"}, { "name" -> "City", "desc" -> "a city", "input" -> "*C.louisiana-_*City-"}, {
"name" -> "Movie", "desc" -> "a movie", "input" -> "*C.louisiana-_*Movie-"}}}}, Typeset`assumptions$$ = {}, Typeset`open$$ = {1, 2}, Typeset`querystate$$ = {
"Online" -> True, "Allowed" -> True, "mparse.jsp" -> 1.692342`6.680033126255685, "Messages" -> {}}},
DynamicBox[ToBoxes[
AlphaIntegration`LinguisticAssistantBoxes["", 4, Automatic,
Dynamic[Typeset`query$$],
Dynamic[Typeset`boxes$$],
Dynamic[Typeset`allassumptions$$],
Dynamic[Typeset`assumptions$$],
Dynamic[Typeset`open$$],
Dynamic[Typeset`querystate$$]], StandardForm],
ImageSizeCache->{366., {7., 17.}},
TrackedSymbols:>{
Typeset`query$$, Typeset`boxes$$, Typeset`allassumptions$$, Typeset`assumptions$$, Typeset`open$$, Typeset`querystate$$}],
DynamicModuleValues:>{},
UndoTrackedVariables:>{Typeset`open$$}],
BaseStyle->{"Deploy"},
DeleteWithContents->True,
Editable->False,
SelectWithContents->True]\)][[;; 5]]](https://www.wolframcloud.com/obj/resourcesystem/images/15c/15cbef62-9274-4f1b-9075-829f08715bb7/4c9cda003068f0e5.png) |
| Out[1]= | 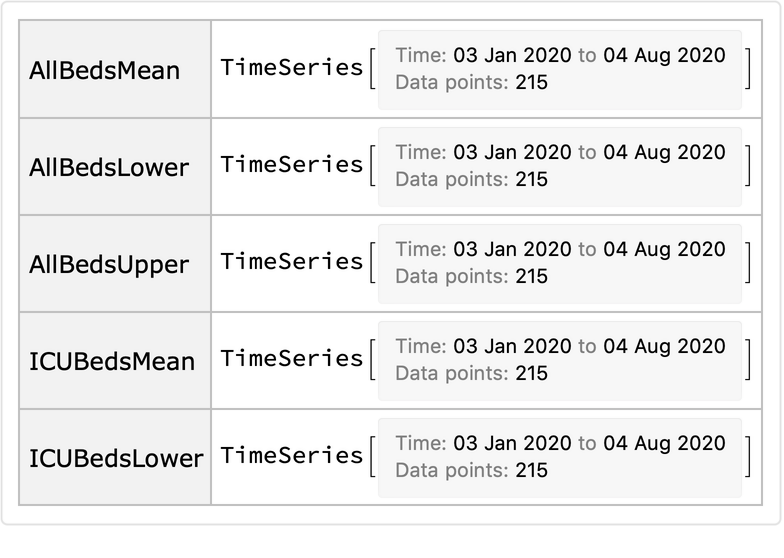 |
Plot upper, lower, and mean estimates for total hospital bed usage for the United States:
| In[2]:= | ![DateListPlot[ResourceData[
ResourceObject["COVID-19 Hospital Resource Use Projections"]][
Entity["Country", "UnitedStates"], {"AllBedsMean", "AllBedsLower", "AllBedsUpper"}], PlotRange -> All]](https://www.wolframcloud.com/obj/resourcesystem/images/15c/15cbef62-9274-4f1b-9075-829f08715bb7/09b892edbbbc3933.png) |
| Out[2]= | 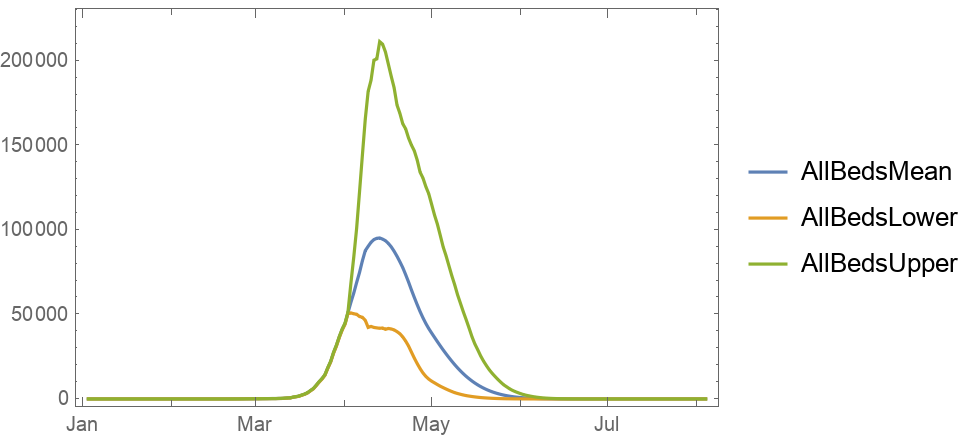 |
Visualize total bed usage at projected peaks within each state:
| In[3]:= | ![GeoRegionValuePlot[Max /@ KeySelect[ResourceData[
ResourceObject["COVID-19 Hospital Resource Use Projections"]], MemberQ[EntityList[
EntityClass["AdministrativeDivision", "AllUSStatesPlusDC"]], #] &][[All, "AllBedsMean"]], GeoRange -> EntityClass["AdministrativeDivision", "ContinentalUSStates"]]](https://www.wolframcloud.com/obj/resourcesystem/images/15c/15cbef62-9274-4f1b-9075-829f08715bb7/6995a7e852ae24cc.png) |
| Out[3]= | 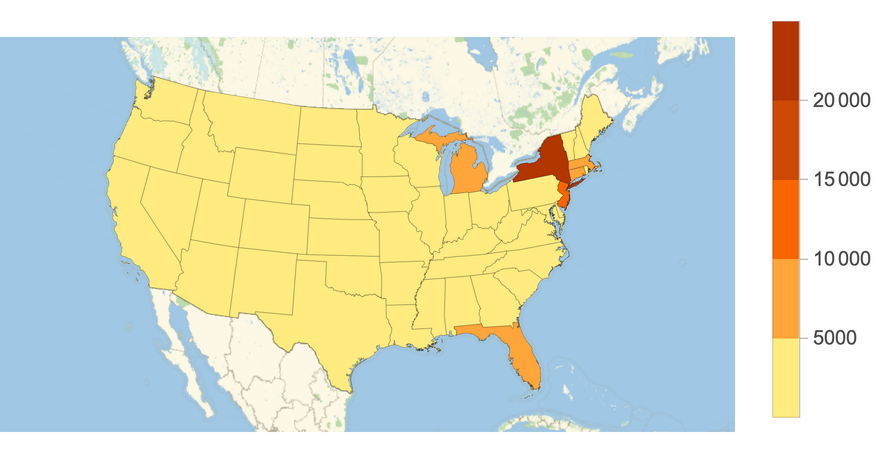 |
Generate an interactive data explorer:
| In[4]:= | ![With[{rd = Normal@ResourceData[
ResourceObject["COVID-19 Hospital Resource Use Projections"]]}, Manipulate[
DateListPlot[rd[loc, prop], PlotRange -> All], {loc, Keys[rd]}, {prop, Keys[rd[[1]]]}]]](https://www.wolframcloud.com/obj/resourcesystem/images/15c/15cbef62-9274-4f1b-9075-829f08715bb7/42596747a9dfa6ea.png) |
| Out[4]= | 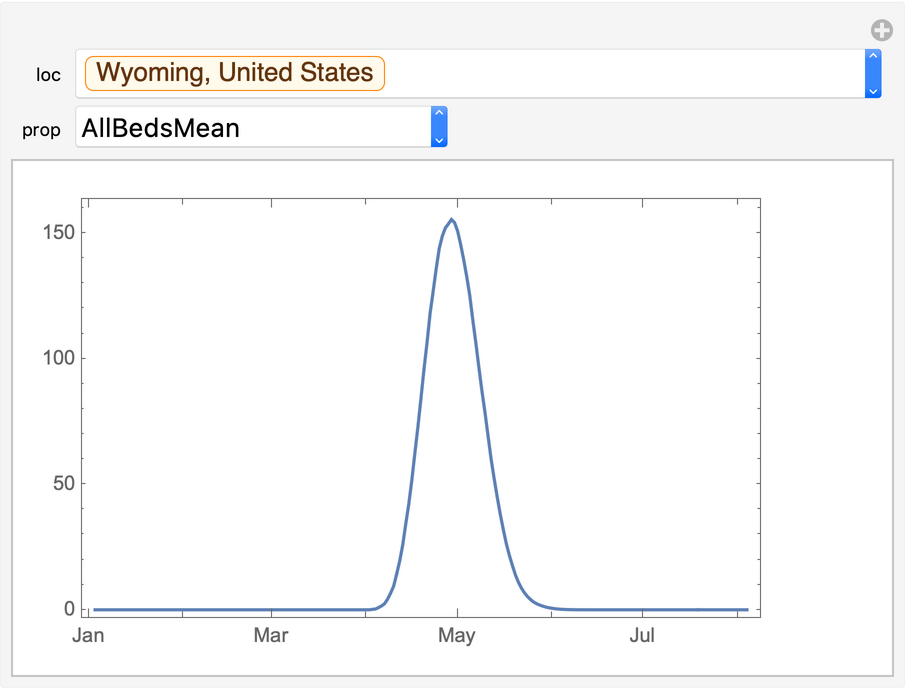 |
Wolfram Research, "COVID-19 Hospital Resource Use Projections" from the Wolfram Data Repository (2020)
CC-BY 4.0