Examples
Basic Examples (2)
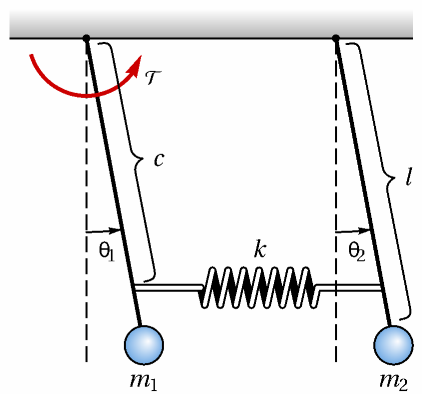
Retrieve the model:
The icon:
Scope & Additional Elements (4)
Available content elements:
The available model types:
The operating point:
The parameters:
Visualizations (3)
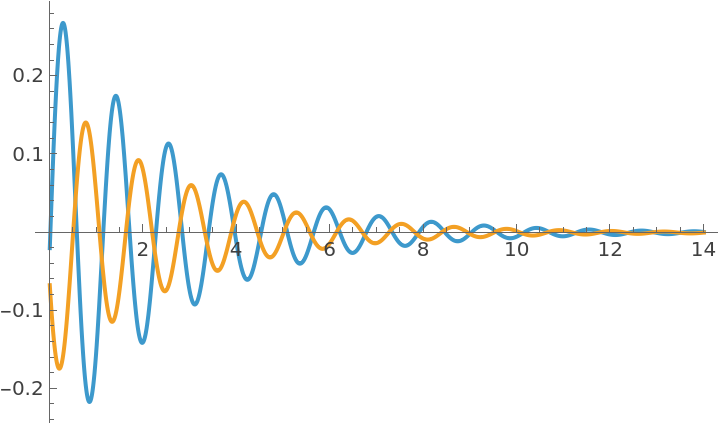
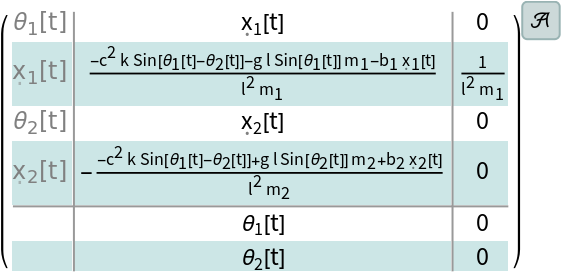
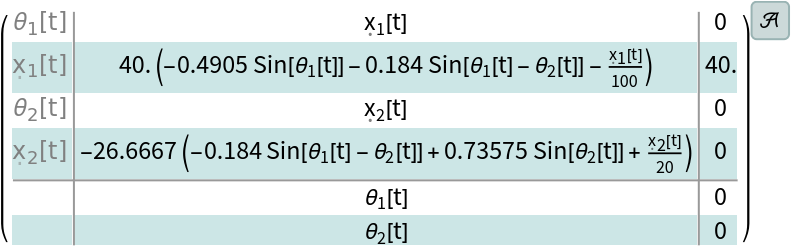
The numerical model:
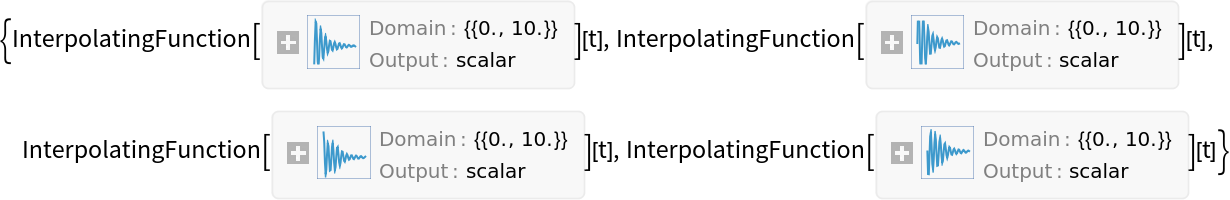
Its state response to an initial displacement of the pendulums:
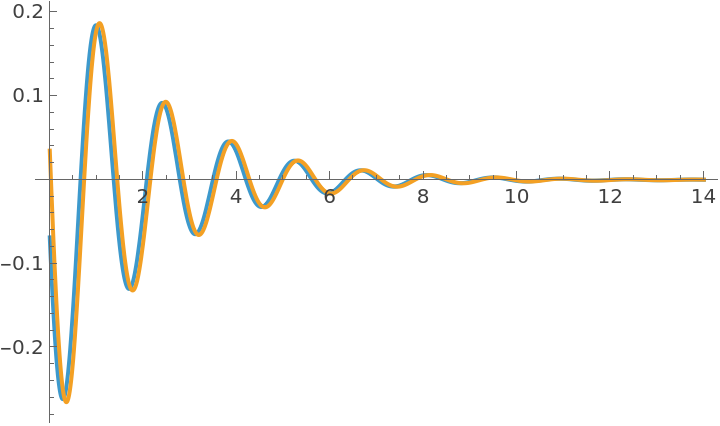
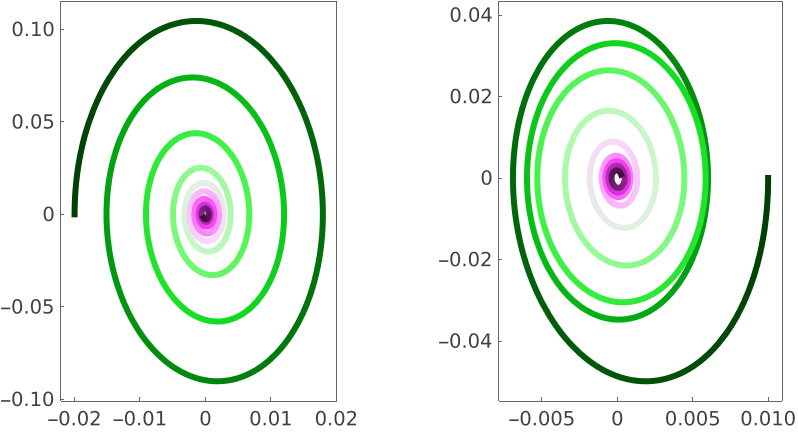
A parametric plot of each of the pendulum's position and angular velocity:
Analysis (3)
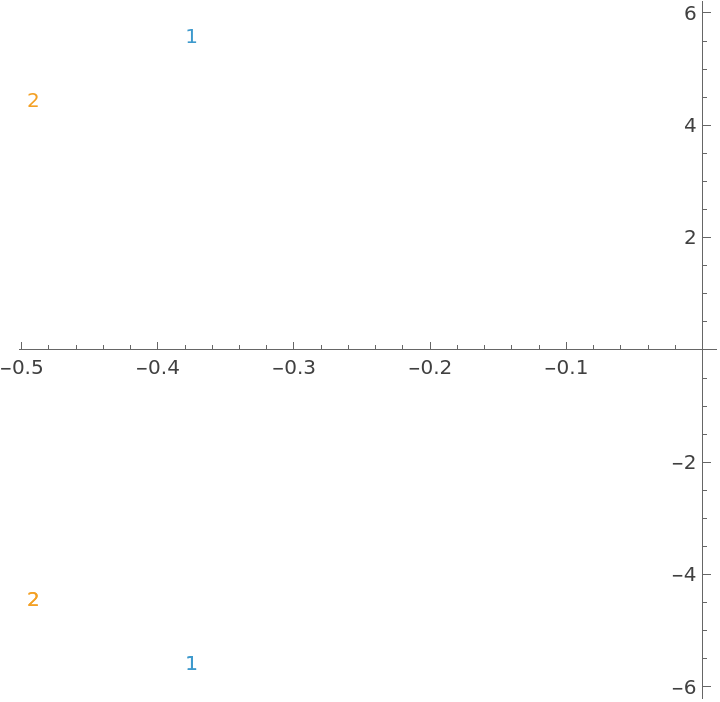
The system has two modes:
In the first mode the pendulums oscillate out of phase:
In the second mode the pendulums oscillate in phase:
Bibliographic Citation
Suba Thomas,
"Coupled Pendulums Model"
from the Wolfram Data Repository
(2025)
Data Resource History
Publisher Information

![pend = ResourceData[\!\(\*
TagBox["\"\<Coupled Pendulums Model\>\"",
#& ,
BoxID -> "ResourceTag-Coupled Pendulums Model-Input",
AutoDelete->True]\)] /. ResourceData[\!\(\*
TagBox["\"\<Coupled Pendulums Model\>\"",
#& ,
BoxID -> "ResourceTag-Coupled Pendulums Model-Input",
AutoDelete->True]\), "Parameters"]](https://www.wolframcloud.com/obj/resourcesystem/images/59f/59f7a220-a6f2-4a21-94bb-85d112223705/4d9431ae8ace43d8.png)
![pend = ResourceData[\!\(\*
TagBox["\"\<Coupled Pendulums Model\>\"",
#& ,
BoxID -> "ResourceTag-Coupled Pendulums Model-Input",
AutoDelete->True]\)] /. ResourceData[\!\(\*
TagBox["\"\<Coupled Pendulums Model\>\"",
#& ,
BoxID -> "ResourceTag-Coupled Pendulums Model-Input",
AutoDelete->True]\), "Parameters"];](https://www.wolframcloud.com/obj/resourcesystem/images/59f/59f7a220-a6f2-4a21-94bb-85d112223705/483a579465134b4d.png)