Wolfram Data Repository
Immediate Computable Access to Curated Contributed Data
Data on political ideology derived from roll-call voting behavior in the US Congress
"Ideological positions are calculated using the DW-NOMINATE (Dynamic Weighted NOMINAl Three-step Estimation). This procedure was developed by Poole and Rosenthal in the 1980s and is a “scaling procedure”, representing legislators on a spatial map. In this sense, a spatial map is much like a road map—the closeness of two legislators on the map shows how similar their voting records are. Using this measure of distance, DW-NOMINATE is able to recover the “dimensions” that inform congressional voting behavior. The primary dimension through most of American history has been “liberal” vs. “conservative” (also referred to as “left” vs. “right”). A second dimension picks up differences within the major political parties over slavery, currency, nativism, civil rights, and lifestyle issues during periods of American history. " (from https://voteview.com/about)
View the data:
| In[1]:= |
| Out[1]= | 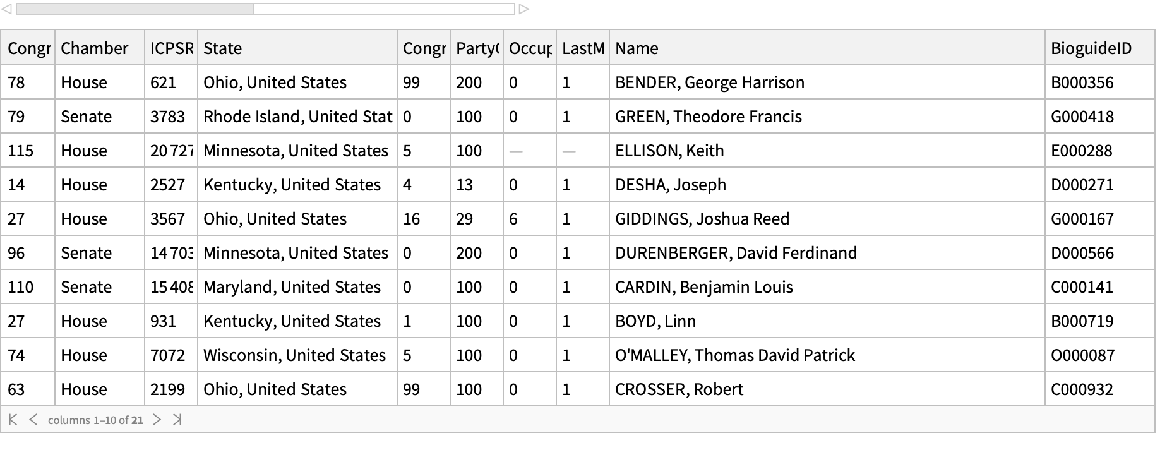 |
Select and group members of the 117th Congress by party, and plot them by both NOMINATE dimensions:
| In[2]:= | ![current = Association /@ GroupBy[Select[ResourceData[\!\(\*
TagBox["\"\<DW-NOMINATE for US Congress\>\"",
#& ,
BoxID -> "ResourceTag-DW-NOMINATE for US Congress-Input",
AutoDelete->True]\)], #CongressNumber == 117 &], #PartyCode &][All, All, #Name -> {#NominateDim1, #NominateDim2} &];
ListPlot[Values@current[[All, All]], PlotStyle -> {Red, Blue, Darker[Green]}, ImageSize -> Full, PlotTheme -> "Detailed"]](https://www.wolframcloud.com/obj/resourcesystem/images/54f/54f6b3a6-add8-4f7f-af7a-3774fe52b504/3bf1a6277291824b.png) |
| Out[3]= | 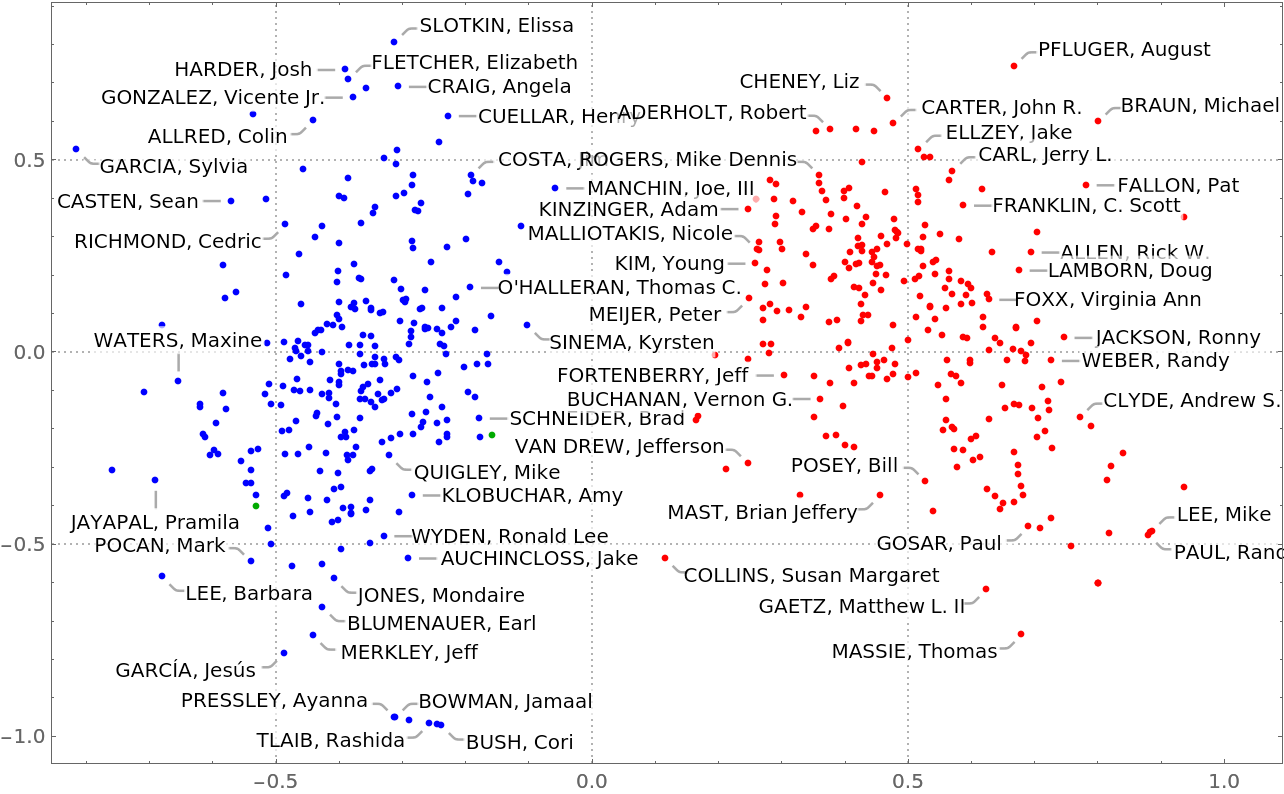 |
Plot ideological scores for Republican, Democratic, and "other" parties across all U.S. Congresses:
| In[4]:= | ![dataWithNames = Append[#, <|
"PartyName" -> Switch[#PartyCode, 100, "Democratic", 200, "Republican", Except[100 | 200], "Other"]|>] & /@ ResourceData[\!\(\*
TagBox["\"\<DW-NOMINATE for US Congress\>\"",
#& ,
BoxID -> "ResourceTag-DW-NOMINATE for US Congress-Input",
AutoDelete->True]\)];
jitter[x_] := RandomReal[{x - .5, x + .5}]
ListPlot[GroupBy[
dataWithNames[
All, {"CongressNumber" -> jitter}], #PartyName &][{"Democratic", "Republican", "Other"}, All, {"CongressNumber", "NominateDim1"}], PlotStyle -> ({Opacity[0.2], #} & /@ {Blue, Red, Darker[Green]}), PlotRange -> {-1.2, 1.2}, PlotTheme -> "Detailed", ImageSize -> 600]](https://www.wolframcloud.com/obj/resourcesystem/images/54f/54f6b3a6-add8-4f7f-af7a-3774fe52b504/1d219ea963c9644e.png) |
| Out[6]= |  |
Wolfram Research, "DW-NOMINATE for US Congress" from the Wolfram Data Repository (2022) https://doi.org/10.24097/wolfram.30617.data