Wolfram Research

Sample Data: England Megalithic Monuments

Source Notebook

Locations of megalithic monuments in England

Details

Locations of megalithic monuments in England annotated by their names.

Examples

Basic Examples (1) 

In[1]:=
ResourceData[\!\(\*
TagBox["\"\<Sample Data: England Megalithic Monuments\>\"",
#& ,
BoxID -> "ResourceTag-Sample Data: England Megalithic Monuments-Input",
AutoDelete->True]\), "Data"]
Out[1]=

Summary of the spatial point data:

In[2]:=
ResourceData[\!\(\*
TagBox["\"\<Sample Data: England Megalithic Monuments\>\"",
#& ,
BoxID -> "ResourceTag-Sample Data: England Megalithic Monuments-Input",
AutoDelete->True]\), "Data"]["Summary"]
Out[2]=

Visualizations (1) 

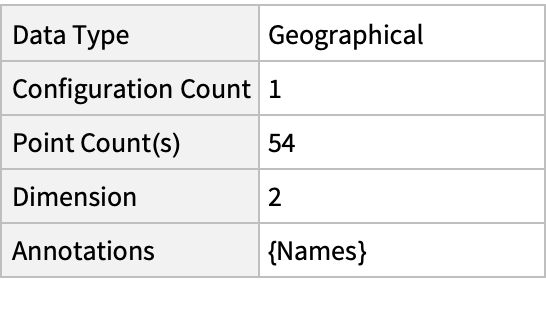
Plot the spatial point data:

In[3]:=
GeoListPlot[ResourceData[\!\(\*
TagBox["\"\<Sample Data: England Megalithic Monuments\>\"",
#& ,
BoxID -> "ResourceTag-Sample Data: England Megalithic Monuments-Input",
AutoDelete->True]\), "Data"]]
Out[3]=

Analysis (2) 

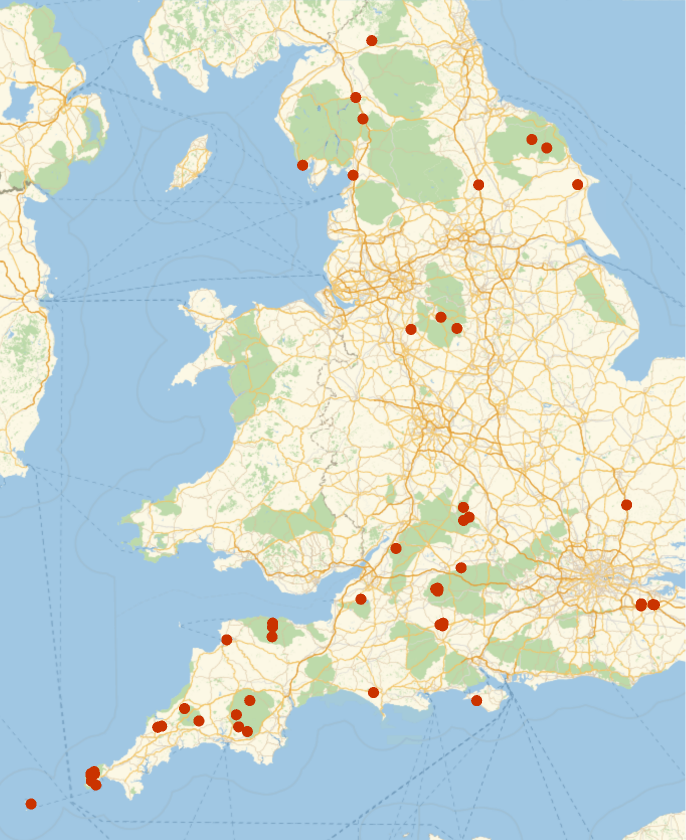
Compute probability of finding a point within given radius of an existing point - NearestNeighborG is the CDF of the nearest neighbor distribution:

In[4]:=
nnG = NearestNeighborG[ResourceData[\!\(\*
TagBox["\"\<Sample Data: England Megalithic Monuments\>\"",
#& ,
BoxID -> "ResourceTag-Sample Data: England Megalithic Monuments-Input",
AutoDelete->True]\), "Data"]]
Out[4]=
In[5]:=
maxR = nnG["MaxRadius"]
Out[5]=
In[6]:=
res = Table[nnG[r], {r, range = Range[maxR/100, maxR, maxR/100]}];
ListPlot[Transpose[{range, res}], Filling -> 0, AxesLabel -> {"radius", "probability"}]
Out[7]=

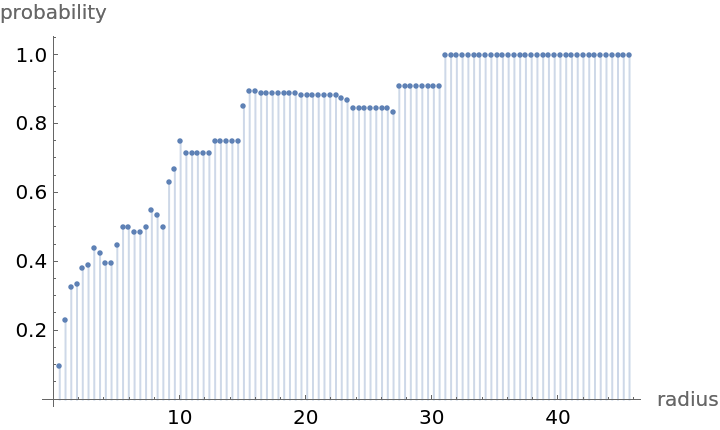
Mean distance between a typical point and its nearest neighbor (for positive support distribution can be approximated via a Riemann sum of 1-CDF):

In[8]:=
step = maxR/100;
partition = Table[{k, k + step}, {k, 0, maxR, step}];
values = nnG[Mean /@ partition];
In[9]:=
Total[(1 - values)*step]
Out[9]=

Gosia Konwerska, "Sample Data: England Megalithic Monuments" from the Wolfram Data Repository (2021)  

Data Resource History

Source Metadata

Publisher Information