Details
The vertices in
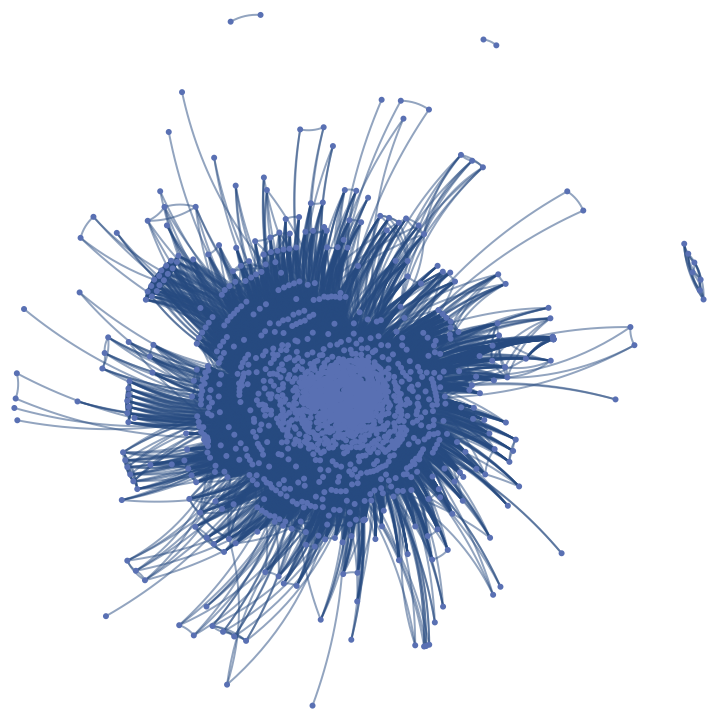
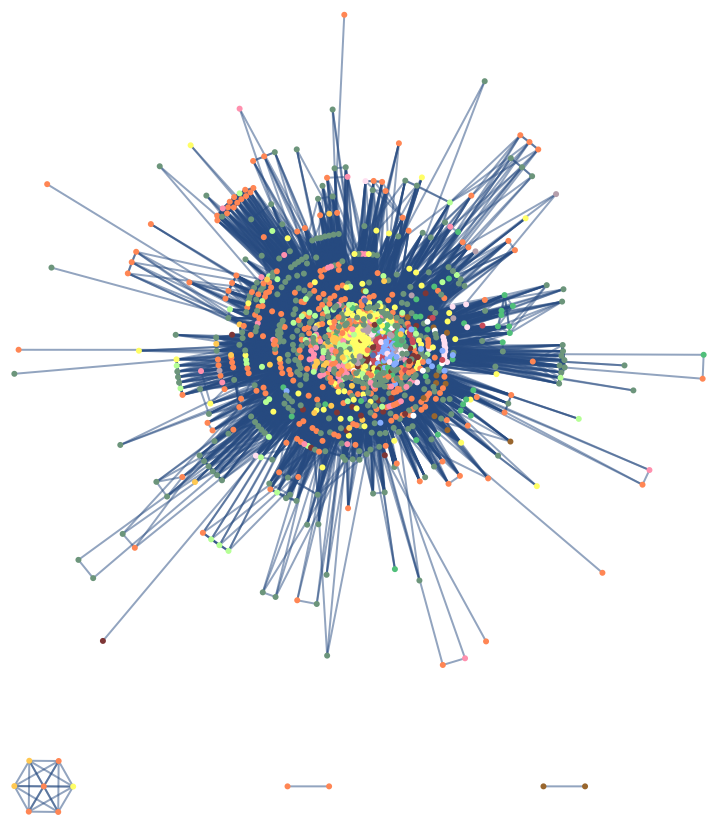
ResourceData["Flavor Network", "FlavorNetwork"] represent food ingredients, while edges connect ingredients that share flavor compounds.
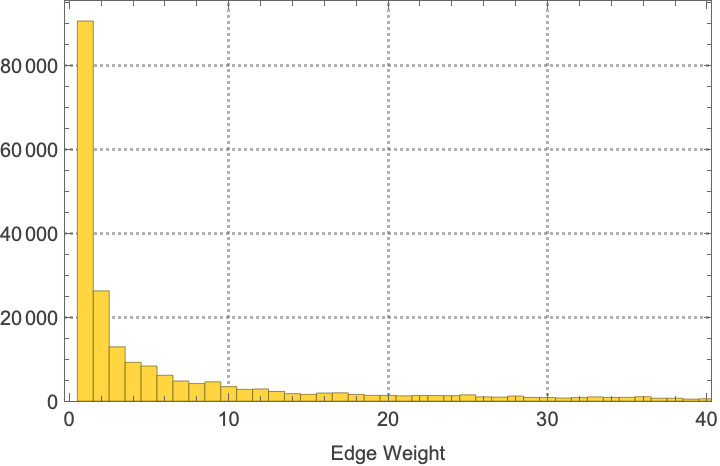
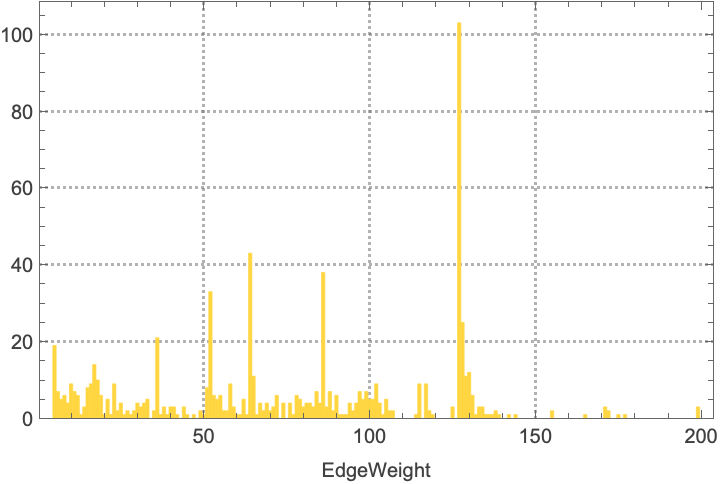
ResourceData["Flavor Network", "FlavorNetworkWeights"] provides the edge weights, defined as the number of flavor compounds shared between each pair of ingredients.
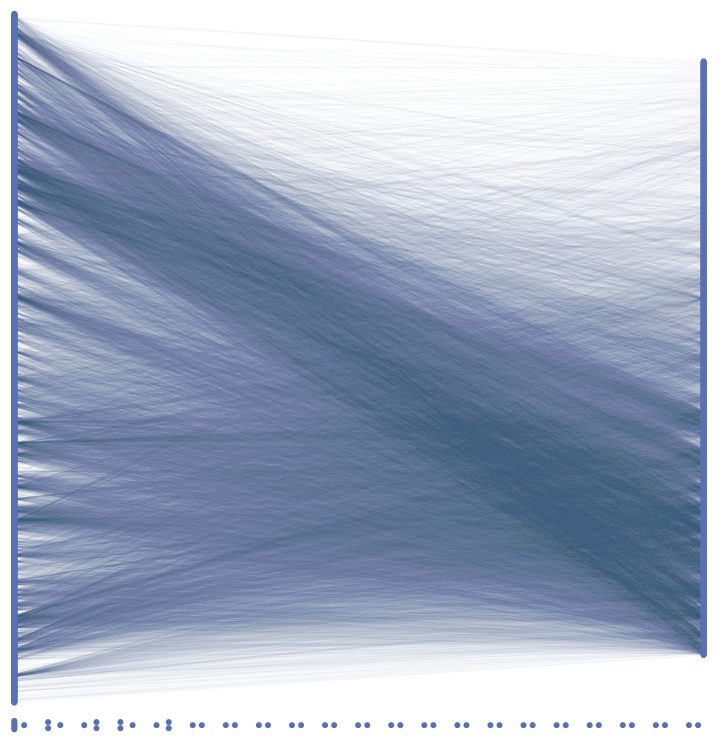
ResourceData["Flavor Network", "FlavorNetwork"] is derived from the flavor profile graph developed by Yong-Yeol Ahn et al.[1]. The original Yong-Yeol Ahn et. al. bipartite graph can be retrieved using
ResourceData["Flavor Network", "FlavorProfile"] and contains 1,530 food ingredients, their associated flavor compounds, and 36,781 the ingredient–compound relationships.
Each ingredient can be classified into a food category using
ResourceData["Flavor Network","IngredientsCategory"], which includes: {"flower", "plant", "plant derivative", "fish/seafood", "herb", "spice", "vegetable", "nut/seed/pulse", "meat", "fruit", "animal product", "cereal/crop", "dairy", "alcoholic beverage"}.
Flavor compounds can be identified using CAS numbers available in
ResourceData["Flavor Network","CAS number"].
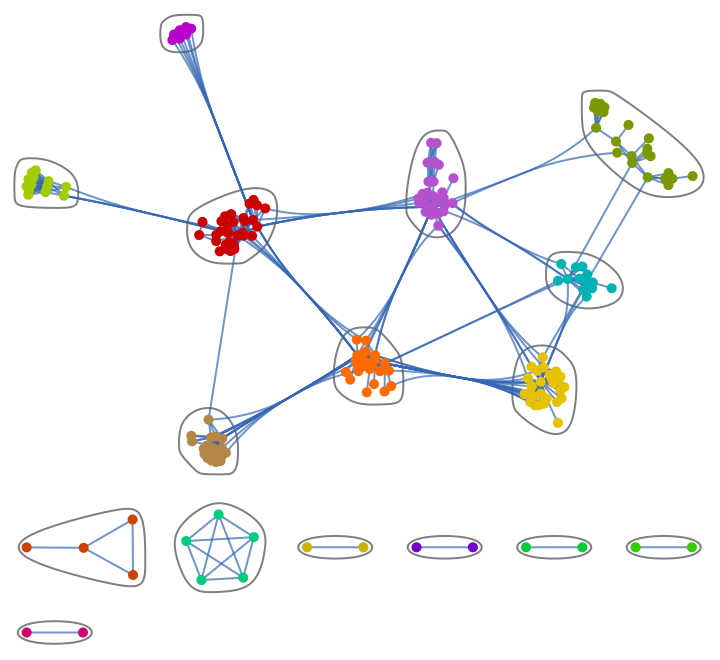
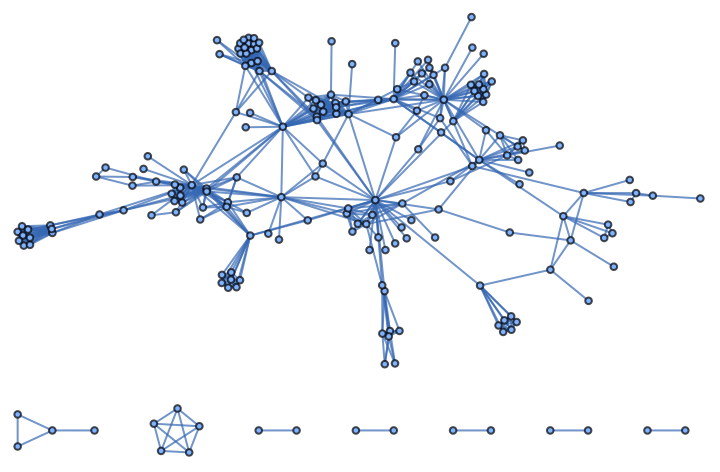
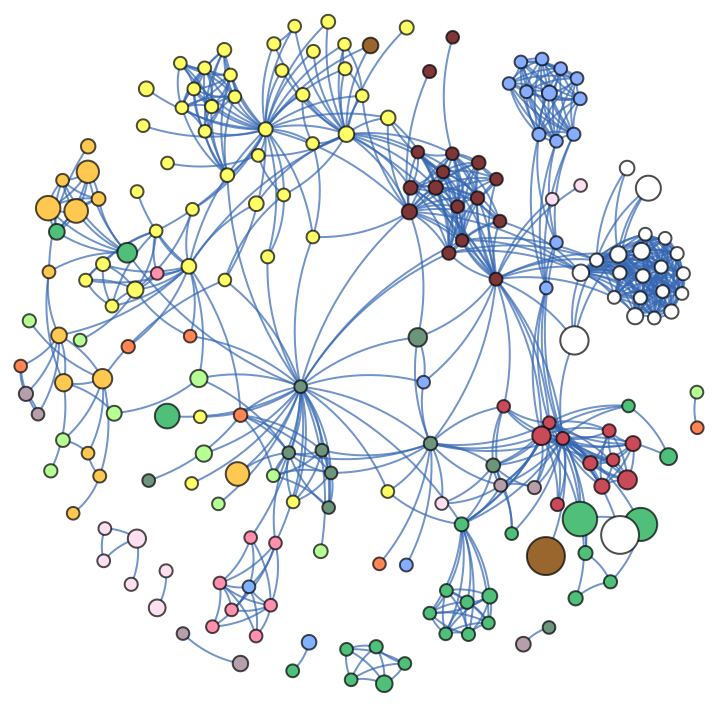
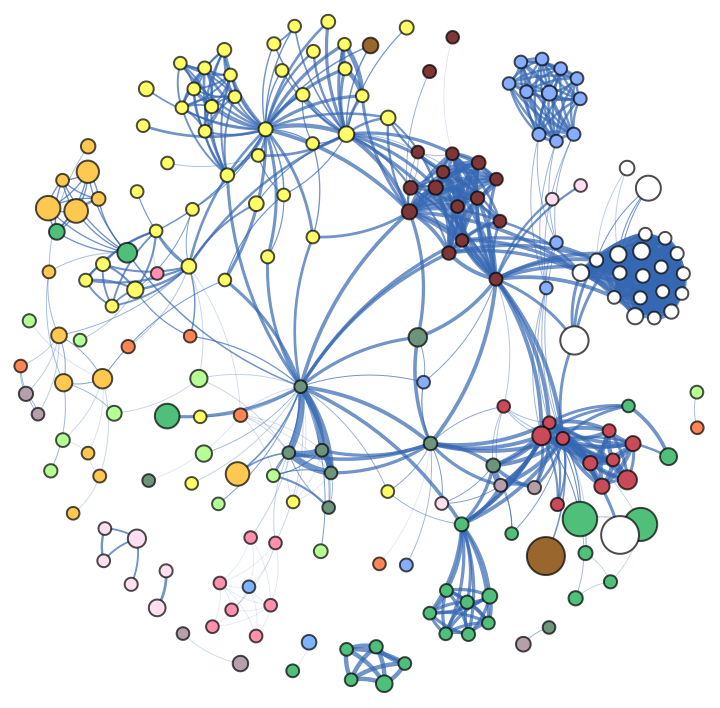
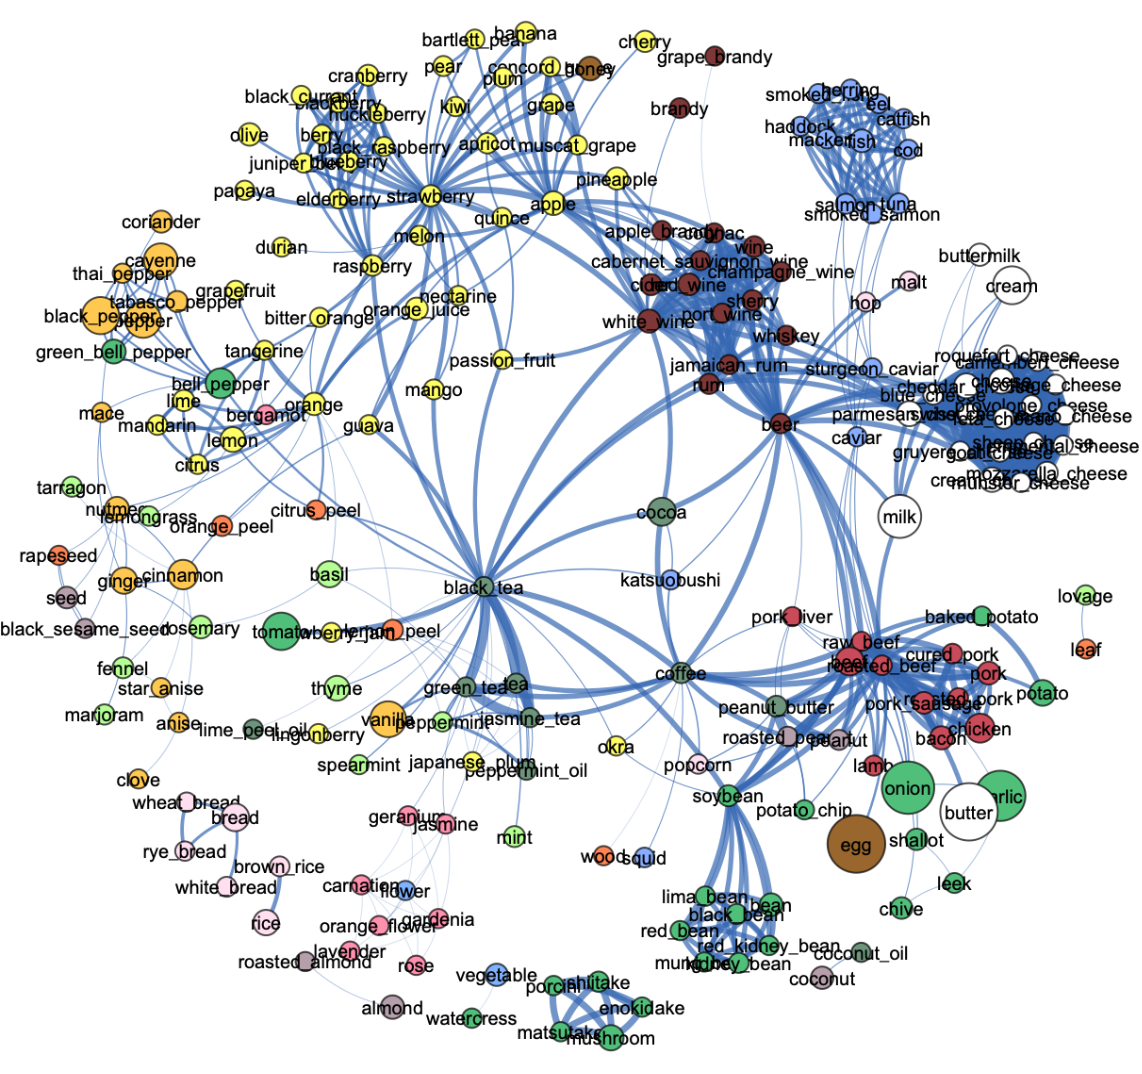
The network is highly dense and difficult to visualize directly. To address this, backbone extraction can be applied to retain only statistically significant connections, producing a sparser graph such as
ResourceData["Flavor Network","Backbone"]. This backbone, originally extracted by Ling
Cheng[2], using data from yummlyrecipes.com, yields a clearer and more interpretable structure while preserving the most relevant flavor relationships.
The flavor network is commonly used to project recipes from ingredient space into flavor space. Applications include building dish recommendation systems based on flavor similarity and identifying dishes with comparable flavor profiles across cuisines.
![GraphPlot[ResourceData[\!\(\*
TagBox["\"\<Flavor Network\>\"",
#& ,
BoxID -> "ResourceTag-Flavor Network-Input",
AutoDelete->True]\), "FlavorNetwork"], GraphLayout -> "GravityEmbedding"]](https://www.wolframcloud.com/obj/resourcesystem/images/c8d/c8d4dcae-5151-499c-9c29-563a6507b110/26a18f582997073d.png)
![GraphPlot[ResourceData[\!\(\*
TagBox["\"\<Flavor Network\>\"",
#& ,
BoxID -> "ResourceTag-Flavor Network-Input",
AutoDelete->True]\), "FlavorProfile"], Sequence[
GraphLayout -> "BipartiteEmbedding", EdgeStyle -> Directive[Thin,
Opacity[0.04]]]]](https://www.wolframcloud.com/obj/resourcesystem/images/c8d/c8d4dcae-5151-499c-9c29-563a6507b110/48a3bac81bff7905.png)
![ResourceData[\!\(\*
TagBox["\"\<Flavor Network\>\"",
#& ,
BoxID -> "ResourceTag-Flavor Network-Input",
AutoDelete->True]\), "Backbone"]](https://www.wolframcloud.com/obj/resourcesystem/images/c8d/c8d4dcae-5151-499c-9c29-563a6507b110/0420550add52e9da.png)
![VertexList[ResourceData[\!\(\*
TagBox["\"\<Flavor Network\>\"",
#& ,
BoxID -> "ResourceTag-Flavor Network-Input",
AutoDelete->True]\), "Backbone"]]](https://www.wolframcloud.com/obj/resourcesystem/images/c8d/c8d4dcae-5151-499c-9c29-563a6507b110/61d6f08dbd0131d3.png)

![WordCloud[Flatten[StringSplit[VertexList[ResourceData[\!\(\*
TagBox["\"\<Flavor Network\>\"",
#& ,
BoxID -> "ResourceTag-Flavor Network-Input",
AutoDelete->True]\), "FlavorNetwork"]], "_"], 1]]](https://www.wolframcloud.com/obj/resourcesystem/images/c8d/c8d4dcae-5151-499c-9c29-563a6507b110/77f0819e6e2fc166.png)
![Histogram[Values[ResourceData[\!\(\*
TagBox["\"\<Flavor Network\>\"",
#& ,
BoxID -> "ResourceTag-Flavor Network-Input",
AutoDelete->True]\), "FlavorNetworkWeights"]], Sequence[
500, FrameLabel -> {"Edge Weight"}, PlotTheme -> "Detailed"]]](https://www.wolframcloud.com/obj/resourcesystem/images/c8d/c8d4dcae-5151-499c-9c29-563a6507b110/06d813a1ed1a7432.png)
![Counts[Values[ResourceData[\!\(\*
TagBox["\"\<Flavor Network\>\"",
#& ,
BoxID -> "ResourceTag-Flavor Network-Input",
AutoDelete->True]\), "IngredientCategory"]]]](https://www.wolframcloud.com/obj/resourcesystem/images/c8d/c8d4dcae-5151-499c-9c29-563a6507b110/7208e91a7890aa63.png)

![color = ResourceData[\!\(\*
TagBox["\"\<Flavor Network\>\"",
#& ,
BoxID -> "ResourceTag-Flavor Network-Input",
AutoDelete->True]\), "IngredientCategory"] /. Thread[{"plant", "fruit", "spice", "herb", "meat", "alcoholic beverage", "cereal/crop", "plant derivative", "dairy",
"vegetable", "fish/seafood", "nut/seed/pulse", "flower", "animal product"} -> {RGBColor[1, 0.525, 0.329], RGBColor[
1, 0.996, 0.399], RGBColor[1, 0.786, 0.317], RGBColor[
0.711, 1, 0.586], RGBColor[0.787, 0.29, 0.34500000000000003`], RGBColor[0.495, 0.21, 0.21], RGBColor[
1, 0.876, 0.9420000000000001], RGBColor[0.425, 0.585, 0.483], GrayLevel[1], RGBColor[0.312, 0.749, 0.47900000000000004`], RGBColor[0.526, 0.68, 1], RGBColor[0.71, 0.622, 0.669], RGBColor[1, 0.5660000000000001, 0.683], RGBColor[
0.6, 0.4, 0.178]}];](https://www.wolframcloud.com/obj/resourcesystem/images/c8d/c8d4dcae-5151-499c-9c29-563a6507b110/5cbb354b8d6760ac.png)
![GraphPlot[ResourceData[\!\(\*
TagBox["\"\<Flavor Network\>\"",
#& ,
BoxID -> "ResourceTag-Flavor Network-Input",
AutoDelete->True]\), "FlavorNetwork"], VertexStyle -> Thread[VertexList[ResourceData[\!\(\*
TagBox["\"\<Flavor Network\>\"",
#& ,
BoxID -> "ResourceTag-Flavor Network-Input",
AutoDelete->True]\), "FlavorNetwork"]] -> (VertexList[ResourceData[\!\(\*
TagBox["\"\<Flavor Network\>\"",
#& ,
BoxID -> "ResourceTag-Flavor Network-Input",
AutoDelete->True]\), "FlavorNetwork"]] /. color)]]](https://www.wolframcloud.com/obj/resourcesystem/images/c8d/c8d4dcae-5151-499c-9c29-563a6507b110/7aa9bce6f8457af8.png)
![color = ResourceData[\!\(\*
TagBox["\"\<Flavor Network\>\"",
#& ,
BoxID -> "ResourceTag-Flavor Network-Input",
AutoDelete->True]\), "IngredientCategory"] /. Thread[{"plant", "fruit", "spice", "herb", "meat", "alcoholic beverage", "cereal/crop", "plant derivative", "dairy",
"vegetable", "fish/seafood", "nut/seed/pulse", "flower", "animal product"} -> {RGBColor[1, 0.525, 0.329], RGBColor[
1, 0.996, 0.399], RGBColor[1, 0.786, 0.317], RGBColor[
0.711, 1, 0.586], RGBColor[0.787, 0.29, 0.34500000000000003`], RGBColor[0.495, 0.21, 0.21], RGBColor[
1, 0.876, 0.9420000000000001], RGBColor[0.425, 0.585, 0.483], GrayLevel[1], RGBColor[0.312, 0.749, 0.47900000000000004`], RGBColor[0.526, 0.68, 1], RGBColor[0.71, 0.622, 0.669], RGBColor[1, 0.5660000000000001, 0.683], RGBColor[
0.6, 0.4, 0.178]}];](https://www.wolframcloud.com/obj/resourcesystem/images/c8d/c8d4dcae-5151-499c-9c29-563a6507b110/0f3a1f30ed29f222.png)
![vertexSize = ((Rescale[#, {-.5, .1}]) & /@ AnnotationValue[ResourceData[\!\(\*
TagBox["\"\<Flavor Network\>\"",
#& ,
BoxID -> "ResourceTag-Flavor Network-Input",
AutoDelete->True]\), "Backbone"], VertexWeight]);](https://www.wolframcloud.com/obj/resourcesystem/images/c8d/c8d4dcae-5151-499c-9c29-563a6507b110/59b2b5819e00cf58.png)
![Graph[ResourceData[\!\(\*
TagBox["\"\<Flavor Network\>\"",
#& ,
BoxID -> "ResourceTag-Flavor Network-Input",
AutoDelete->True]\), "Backbone"], GraphLayout -> "GravityEmbedding", VertexStyle -> color, VertexSize -> Thread[VertexList[ResourceData[\!\(\*
TagBox["\"\<Flavor Network\>\"",
#& ,
BoxID -> "ResourceTag-Flavor Network-Input",
AutoDelete->True]\), "Backbone"]] -> vertexSize]]](https://www.wolframcloud.com/obj/resourcesystem/images/c8d/c8d4dcae-5151-499c-9c29-563a6507b110/3c39f66badf33d06.png)
![color = ResourceData[\!\(\*
TagBox["\"\<Flavor Network\>\"",
#& ,
BoxID -> "ResourceTag-Flavor Network-Input",
AutoDelete->True]\), "IngredientCategory"] /. Thread[{"plant", "fruit", "spice", "herb", "meat", "alcoholic beverage", "cereal/crop", "plant derivative", "dairy",
"vegetable", "fish/seafood", "nut/seed/pulse", "flower", "animal product"} -> {RGBColor[1, 0.525, 0.329], RGBColor[
1, 0.996, 0.399], RGBColor[1, 0.786, 0.317], RGBColor[
0.711, 1, 0.586], RGBColor[0.787, 0.29, 0.34500000000000003`], RGBColor[0.495, 0.21, 0.21], RGBColor[
1, 0.876, 0.9420000000000001], RGBColor[0.425, 0.585, 0.483], GrayLevel[1], RGBColor[0.312, 0.749, 0.47900000000000004`], RGBColor[0.526, 0.68, 1], RGBColor[0.71, 0.622, 0.669], RGBColor[1, 0.5660000000000001, 0.683], RGBColor[
0.6, 0.4, 0.178]}];](https://www.wolframcloud.com/obj/resourcesystem/images/c8d/c8d4dcae-5151-499c-9c29-563a6507b110/3d485530e111d5d5.png)
![vertexSize = ((Rescale[#, {-.5, .1}]) & /@ AnnotationValue[ResourceData[\!\(\*
TagBox["\"\<Flavor Network\>\"",
#& ,
BoxID -> "ResourceTag-Flavor Network-Input",
AutoDelete->True]\), "Backbone"], VertexWeight]);](https://www.wolframcloud.com/obj/resourcesystem/images/c8d/c8d4dcae-5151-499c-9c29-563a6507b110/13d661e51a679dfe.png)
![edgeStye = Thread[{(Thickness[#] & /@ (AnnotationValue[ResourceData[\!\(\*
TagBox["\"\<Flavor Network\>\"",
#& ,
BoxID -> "ResourceTag-Flavor Network-Input",
AutoDelete->True]\), "Backbone"], EdgeWeight]/19000.))}];](https://www.wolframcloud.com/obj/resourcesystem/images/c8d/c8d4dcae-5151-499c-9c29-563a6507b110/0375d064edfb002b.png)
![Graph[ResourceData[\!\(\*
TagBox["\"\<Flavor Network\>\"",
#& ,
BoxID -> "ResourceTag-Flavor Network-Input",
AutoDelete->True]\), "Backbone"], GraphLayout -> "GravityEmbedding", VertexStyle -> color, VertexSize -> Thread[VertexList[ResourceData[\!\(\*
TagBox["\"\<Flavor Network\>\"",
#& ,
BoxID -> "ResourceTag-Flavor Network-Input",
AutoDelete->True]\), "Backbone"]] -> vertexSize], EdgeStyle -> Thread[EdgeList[ResourceData[\!\(\*
TagBox["\"\<Flavor Network\>\"",
#& ,
BoxID -> "ResourceTag-Flavor Network-Input",
AutoDelete->True]\), "Backbone"]] -> edgeStye]]](https://www.wolframcloud.com/obj/resourcesystem/images/c8d/c8d4dcae-5151-499c-9c29-563a6507b110/5ada30f68c8e1c57.png)
![color = ResourceData[\!\(\*
TagBox["\"\<Flavor Network\>\"",
#& ,
BoxID -> "ResourceTag-Flavor Network-Input",
AutoDelete->True]\), "IngredientCategory"] /. Thread[{"plant", "fruit", "spice", "herb", "meat", "alcoholic beverage", "cereal/crop", "plant derivative", "dairy",
"vegetable", "fish/seafood", "nut/seed/pulse", "flower", "animal product"} -> {RGBColor[1, 0.525, 0.329], RGBColor[
1, 0.996, 0.399], RGBColor[1, 0.786, 0.317], RGBColor[
0.711, 1, 0.586], RGBColor[0.787, 0.29, 0.34500000000000003`], RGBColor[0.495, 0.21, 0.21], RGBColor[
1, 0.876, 0.9420000000000001], RGBColor[0.425, 0.585, 0.483], GrayLevel[1], RGBColor[0.312, 0.749, 0.47900000000000004`], RGBColor[0.526, 0.68, 1], RGBColor[0.71, 0.622, 0.669], RGBColor[1, 0.5660000000000001, 0.683], RGBColor[
0.6, 0.4, 0.178]}];](https://www.wolframcloud.com/obj/resourcesystem/images/c8d/c8d4dcae-5151-499c-9c29-563a6507b110/2ed6873393177ecb.png)
![vertexSize = ((Rescale[#, {-.5, .1}]) & /@ AnnotationValue[ResourceData[\!\(\*
TagBox["\"\<Flavor Network\>\"",
#& ,
BoxID -> "ResourceTag-Flavor Network-Input",
AutoDelete->True]\), "Backbone"], VertexWeight]);](https://www.wolframcloud.com/obj/resourcesystem/images/c8d/c8d4dcae-5151-499c-9c29-563a6507b110/45089fcb59866cba.png)
![edgeStye = Thread[{(Thickness[#] & /@ (AnnotationValue[ResourceData[\!\(\*
TagBox["\"\<Flavor Network\>\"",
#& ,
BoxID -> "ResourceTag-Flavor Network-Input",
AutoDelete->True]\), "Backbone"], EdgeWeight]/19000.))}];](https://www.wolframcloud.com/obj/resourcesystem/images/c8d/c8d4dcae-5151-499c-9c29-563a6507b110/44f08f801640b073.png)
![Graph[ResourceData[\!\(\*
TagBox["\"\<Flavor Network\>\"",
#& ,
BoxID -> "ResourceTag-Flavor Network-Input",
AutoDelete->True]\), "Backbone"], GraphLayout -> "GravityEmbedding", VertexStyle -> color, VertexSize -> Thread[VertexList[ResourceData[\!\(\*
TagBox["\"\<Flavor Network\>\"",
#& ,
BoxID -> "ResourceTag-Flavor Network-Input",
AutoDelete->True]\), "Backbone"]] -> vertexSize], EdgeStyle -> Thread[EdgeList[ResourceData[\!\(\*
TagBox["\"\<Flavor Network\>\"",
#& ,
BoxID -> "ResourceTag-Flavor Network-Input",
AutoDelete->True]\), "Backbone"]] -> edgeStye],
VertexLabels -> Placed[Automatic, Center]]](https://www.wolframcloud.com/obj/resourcesystem/images/c8d/c8d4dcae-5151-499c-9c29-563a6507b110/3d3114c48d506272.png)
![VertexCount[ResourceData[\!\(\*
TagBox["\"\<Flavor Network\>\"",
#& ,
BoxID -> "ResourceTag-Flavor Network-Input",
AutoDelete->True]\), "FlavorNetwork"]]](https://www.wolframcloud.com/obj/resourcesystem/images/c8d/c8d4dcae-5151-499c-9c29-563a6507b110/17ba3f0c2d7f20fd.png)

![EdgeCount[ResourceData[\!\(\*
TagBox["\"\<Flavor Network\>\"",
#& ,
BoxID -> "ResourceTag-Flavor Network-Input",
AutoDelete->True]\), "FlavorNetwork"]]](https://www.wolframcloud.com/obj/resourcesystem/images/c8d/c8d4dcae-5151-499c-9c29-563a6507b110/324af257616476ae.png)

![GraphDiameter[ResourceData[\!\(\*
TagBox["\"\<Flavor Network\>\"",
#& ,
BoxID -> "ResourceTag-Flavor Network-Input",
AutoDelete->True]\), "FlavorNetwork"]]](https://www.wolframcloud.com/obj/resourcesystem/images/c8d/c8d4dcae-5151-499c-9c29-563a6507b110/55fed16608177a43.png)

![GraphRadius[ResourceData[\!\(\*
TagBox["\"\<Flavor Network\>\"",
#& ,
BoxID -> "ResourceTag-Flavor Network-Input",
AutoDelete->True]\), "FlavorNetwork"]]](https://www.wolframcloud.com/obj/resourcesystem/images/c8d/c8d4dcae-5151-499c-9c29-563a6507b110/202521353db1e02b.png)

![WeightedGraphQ[ResourceData[\!\(\*
TagBox["\"\<Flavor Network\>\"",
#& ,
BoxID -> "ResourceTag-Flavor Network-Input",
AutoDelete->True]\), "Backbone"]]](https://www.wolframcloud.com/obj/resourcesystem/images/c8d/c8d4dcae-5151-499c-9c29-563a6507b110/711a7a376a4bbc4a.png)

![Histogram[AnnotationValue[ResourceData[\!\(\*
TagBox["\"\<Flavor Network\>\"",
#& ,
BoxID -> "ResourceTag-Flavor Network-Input",
AutoDelete->True]\), "Backbone"], VertexWeight], 500, FrameLabel -> {"VertexWeight"}, PlotTheme -> "Detailed"]](https://www.wolframcloud.com/obj/resourcesystem/images/c8d/c8d4dcae-5151-499c-9c29-563a6507b110/31f818586f185c98.png)
![Histogram[AnnotationValue[ResourceData[\!\(\*
TagBox["\"\<Flavor Network\>\"",
#& ,
BoxID -> "ResourceTag-Flavor Network-Input",
AutoDelete->True]\), "Backbone"], EdgeWeight], Sequence[
500, FrameLabel -> {"EdgeWeight"}, PlotTheme -> "Detailed"]]](https://www.wolframcloud.com/obj/resourcesystem/images/c8d/c8d4dcae-5151-499c-9c29-563a6507b110/22f349907b72527e.png)
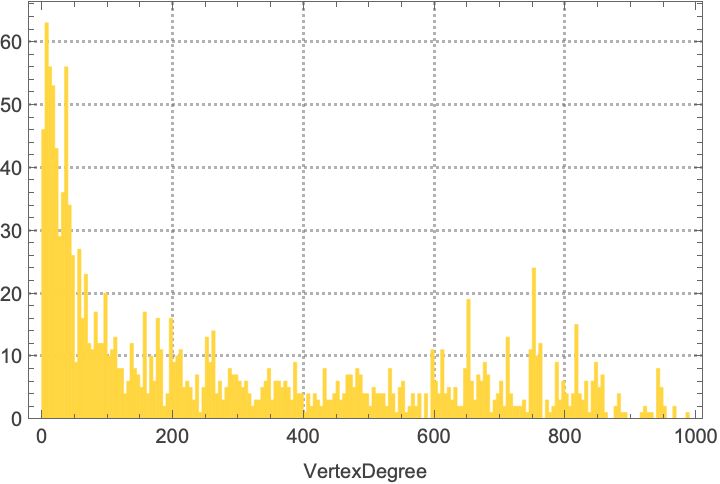
![Histogram[VertexDegree[ResourceData[\!\(\*
TagBox["\"\<Flavor Network\>\"",
#& ,
BoxID -> "ResourceTag-Flavor Network-Input",
AutoDelete->True]\), "FlavorNetwork"]], Sequence[
200, FrameLabel -> {"VertexDegree"}, PlotTheme -> "Detailed"]]](https://www.wolframcloud.com/obj/resourcesystem/images/c8d/c8d4dcae-5151-499c-9c29-563a6507b110/0c65e81d871fddc9.png)
![FindGraphCommunities[ResourceData[\!\(\*
TagBox["\"\<Flavor Network\>\"",
#& ,
BoxID -> "ResourceTag-Flavor Network-Input",
AutoDelete->True]\), "Backbone"]]](https://www.wolframcloud.com/obj/resourcesystem/images/c8d/c8d4dcae-5151-499c-9c29-563a6507b110/3034424c8872219b.png)

![CommunityGraphPlot[ResourceData[\!\(\*
TagBox["\"\<Flavor Network\>\"",
#& ,
BoxID -> "ResourceTag-Flavor Network-Input",
AutoDelete->True]\), "Backbone"]]](https://www.wolframcloud.com/obj/resourcesystem/images/c8d/c8d4dcae-5151-499c-9c29-563a6507b110/3c44ad3eba8bbdc9.png)