Examples
Basic Examples (5)
Retrieve and load the entity store:
Find out the number of molecules in the set:
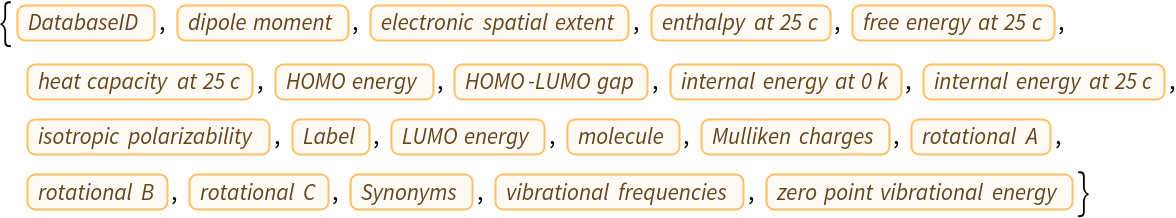
Find out the available properties:
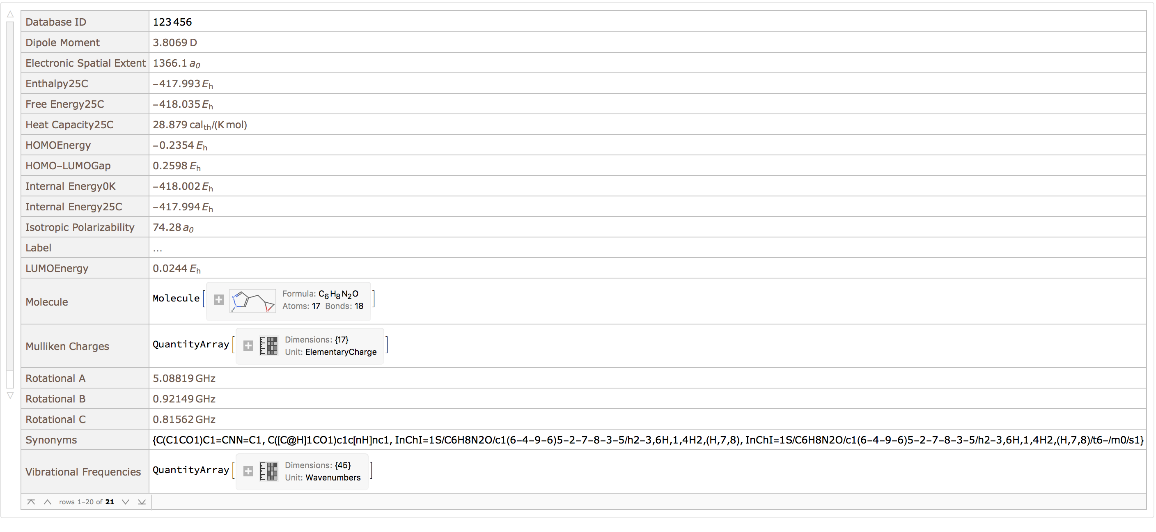
View all property values for a single entity:
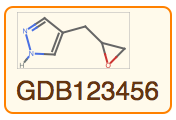
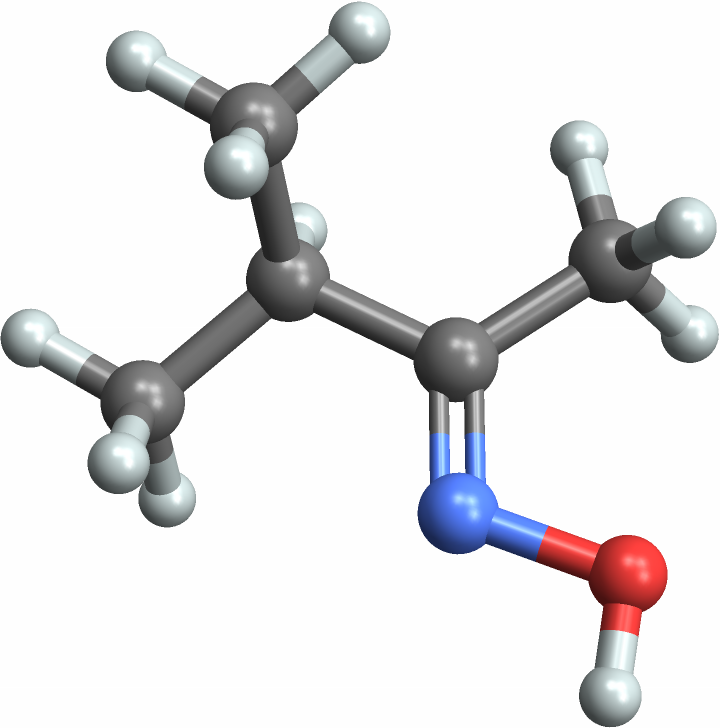
Query for the Molecule from an entity:
Scope & Additional Elements (5)
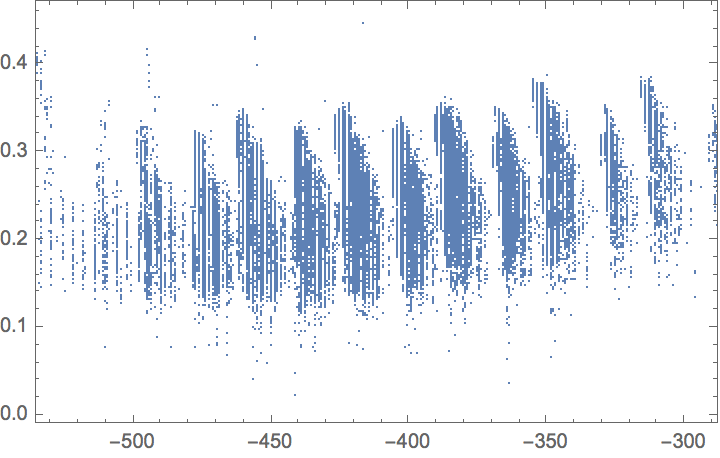
Properties included in the original dataset are available via EntityValue. Make a scatter plot comparing the internal energy calculated at absolute zero versus the HOMO-LUMO gap:
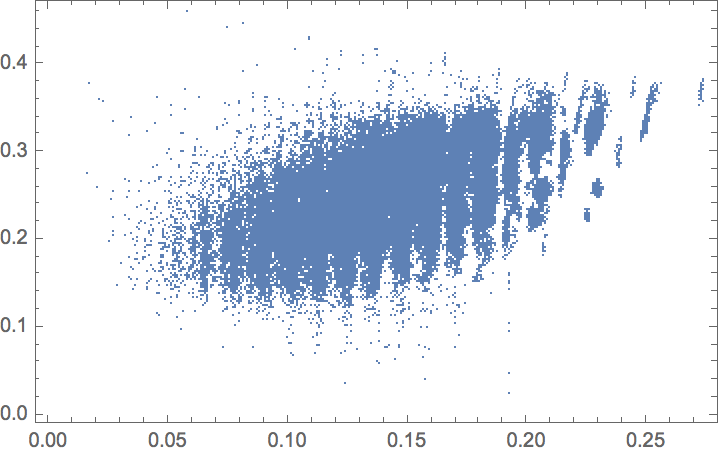
Compare the zero-point energy with the HOMO-LUMO gap:
You can compute many more properties than were in the original dataset by creating a Molecule. First take a random entity:
Now get the "Molecule" property:
Use MoleculeValue to compute properties from the chemical structure:
Visualizations (1)
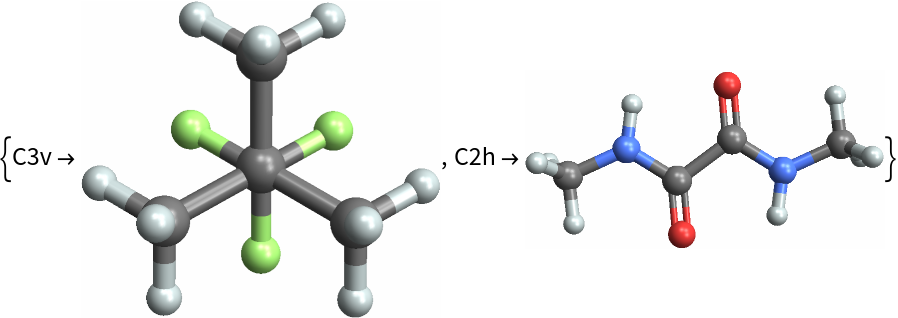
Choose a random set of entities and find those with higher symmetry:
Analysis (4)
In this example we find the entities with the most rings. First grab all the molecules from the dataset. Use the "DynamicMap" resource function since this operation takes some time:
Find the distribution of ring counts:
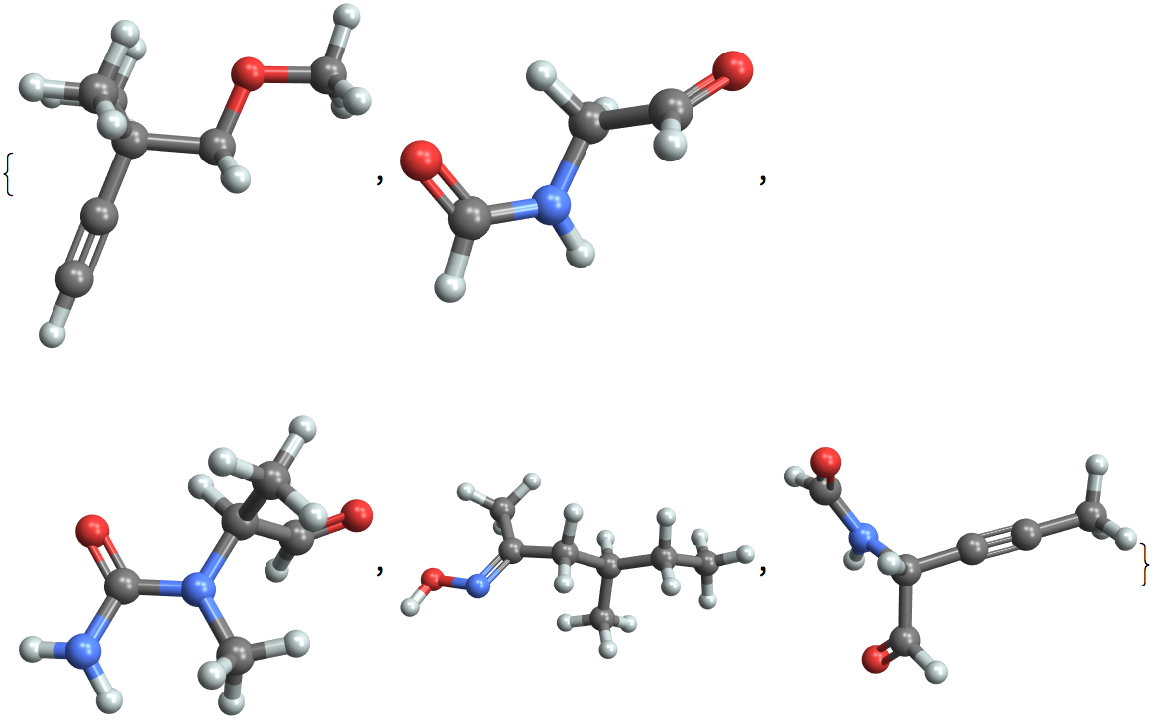
Make 3D plots of some of the acyclic molecules:
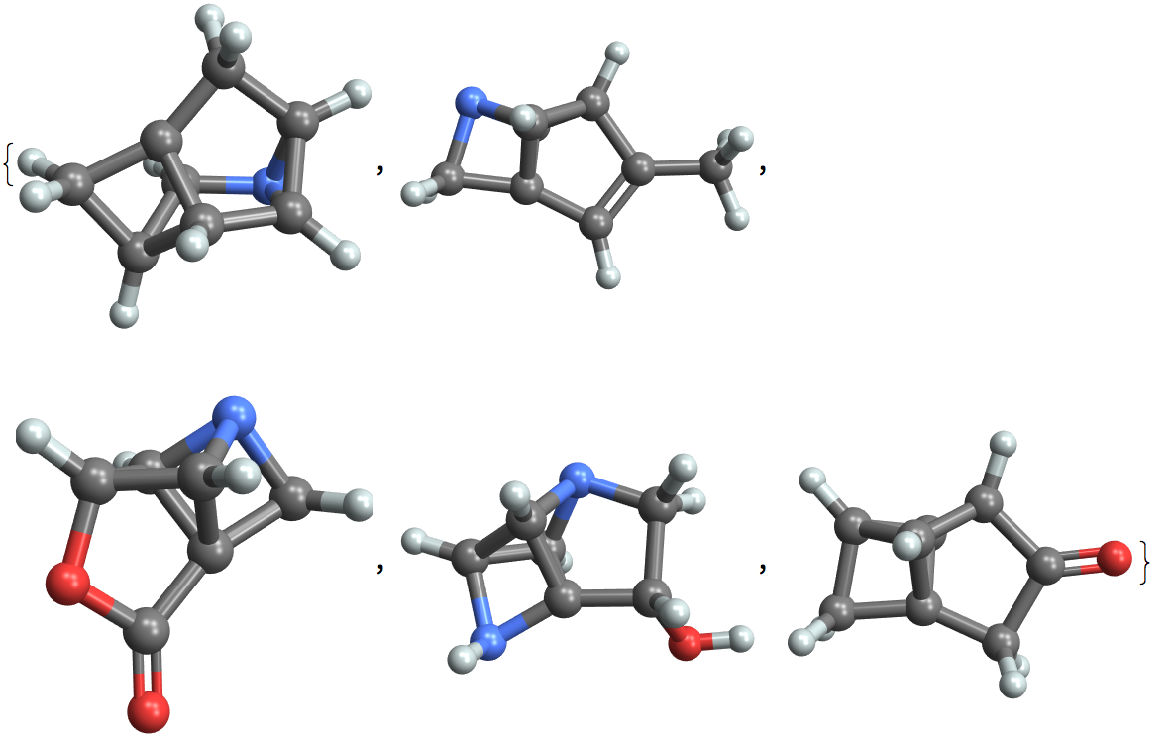
Visualize molecules with high ring counts:
External Links
Bibliographic Citation
Wolfram Research,
"GDB-9 Database"
from the Wolfram Data Repository
(2021)
https://doi.org/10.24097/wolfram.99752.data
CC0 waiver
http://www.nature.com/sdata/
Data Resource History
See Also
Publisher Information
![EntityRegister[ResourceData[\!\(\*
TagBox["\"\<GDB-9 Database\>\"",
#& ,
BoxID -> "ResourceTag-GDB-9 Database-Input",
AutoDelete->True]\)]]; ListPlot[
EntityValue[
"GDB9Chemical", {EntityProperty["GDB9Chemical", "InternalEnergy0K"],
EntityProperty["GDB9Chemical", "HOMO-LUMOGap"]}], Frame -> True]](https://www.wolframcloud.com/obj/resourcesystem/images/18e/18e5d5cf-cdea-428e-bfb2-bb619469019d/276e2ea1584368d9.png)
![ListPlot[
EntityValue[
"GDB9Chemical", {EntityProperty["GDB9Chemical", "ZeroPointVibrationalEnergy"], EntityProperty["GDB9Chemical", "HOMO-LUMOGap"]}], Frame -> True]](https://www.wolframcloud.com/obj/resourcesystem/images/18e/18e5d5cf-cdea-428e-bfb2-bb619469019d/2c95410b48d88a69.png)
![EntityRegister[ResourceData[\!\(\*
TagBox["\"\<GDB-9 Database\>\"",
#& ,
BoxID -> "ResourceTag-GDB-9 Database-Input",
AutoDelete->True]\)]]; molecules = ResourceFunction["DynamicMap"][
EntityProperty["GDB9Chemical", "Molecule"], EntityList["GDB9Chemical"]];](https://www.wolframcloud.com/obj/resourcesystem/images/18e/18e5d5cf-cdea-428e-bfb2-bb619469019d/202cabb87a80050e.png)