Wolfram Data Repository
Immediate Computable Access to Curated Contributed Data
Changes in obesity rates from 1975 to 2014
(5 columns, 200 rows)
Retrieve the dataset:
| In[1]:= |
| Out[1]= | 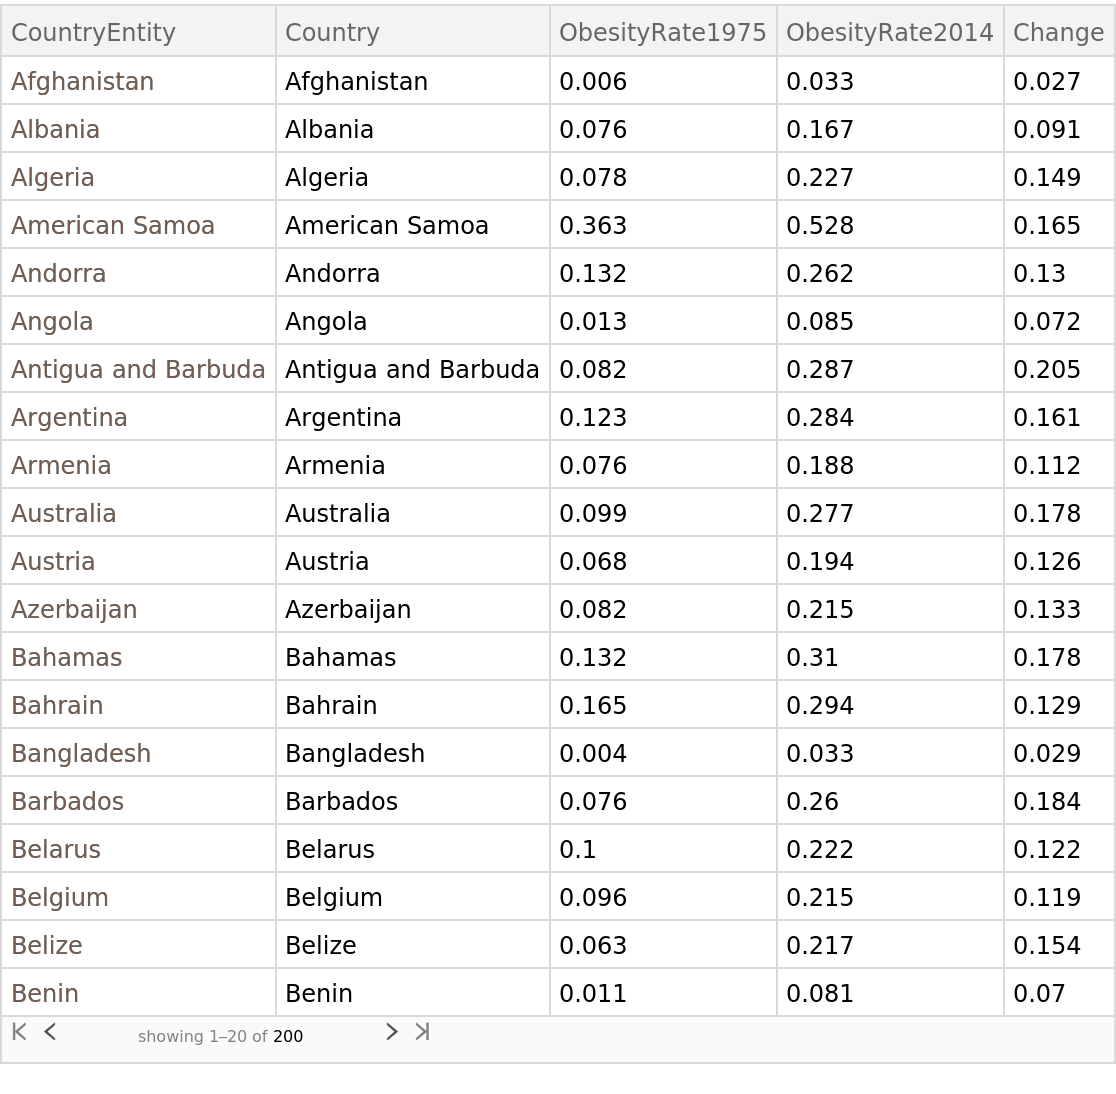 |
Plot which countries experienced the greatest changes in obesity rates:
| In[2]:= |
| Out[2]= | 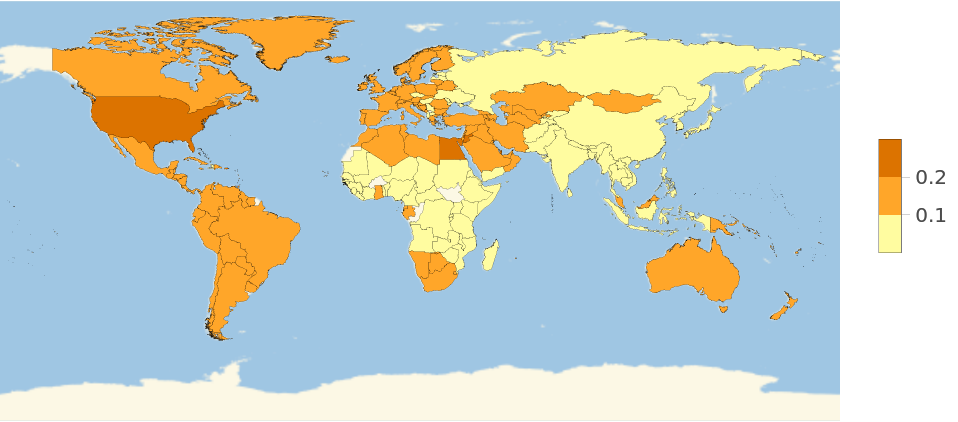 |
List the countries with the smallest increase in obesity:
| In[3]:= |
| Out[3]= | 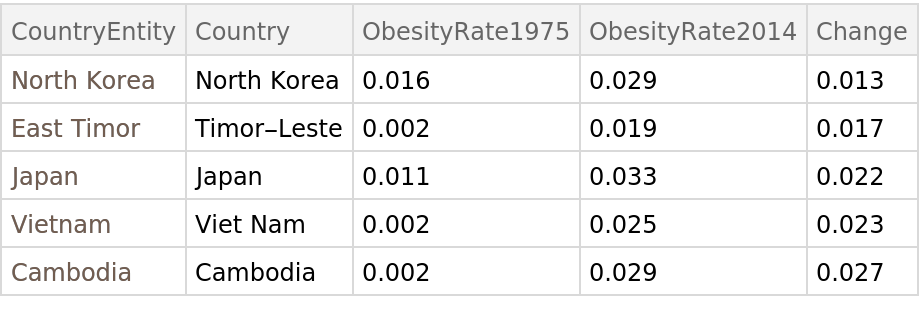 |
Wolfram Research, "Global Obesity Rates" from the Wolfram Data Repository (2017) https://doi.org/10.24097/wolfram.13096.data