Examples
Basic Examples (3)
Retrieve the model:
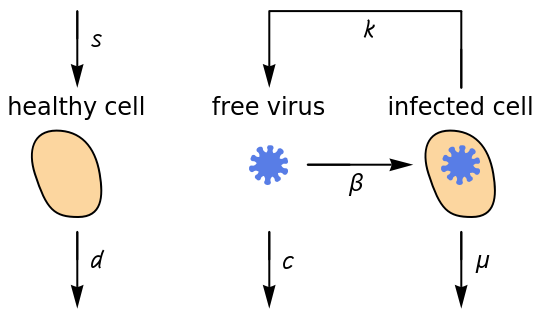
The icon:
The annotation:
Scope & Additional Elements (4)
Available content elements:
The available model types:
The operating point:
The parameters:
Visualizations (1)
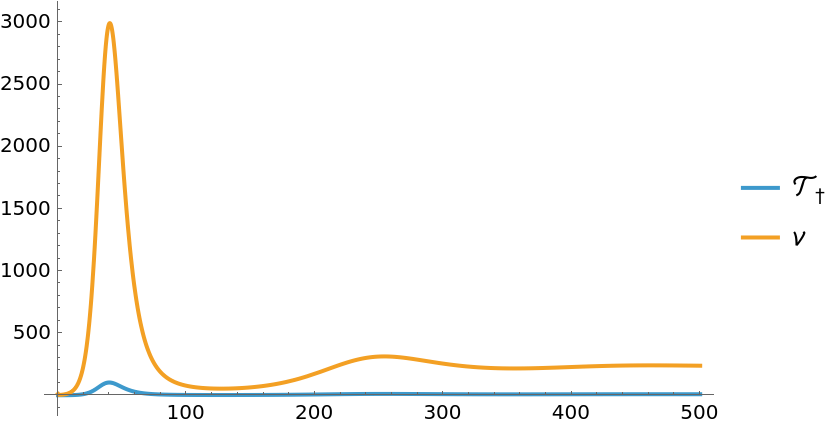
A plot of the model's response to a course of anti-viral medication:
Analysis (4)
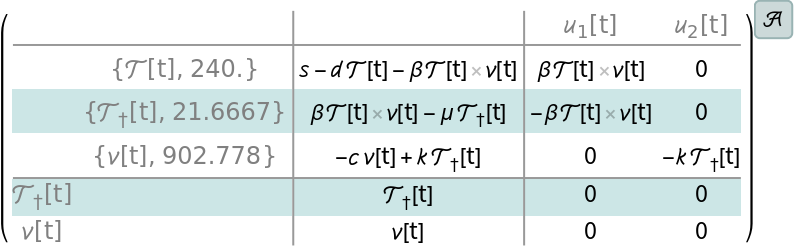
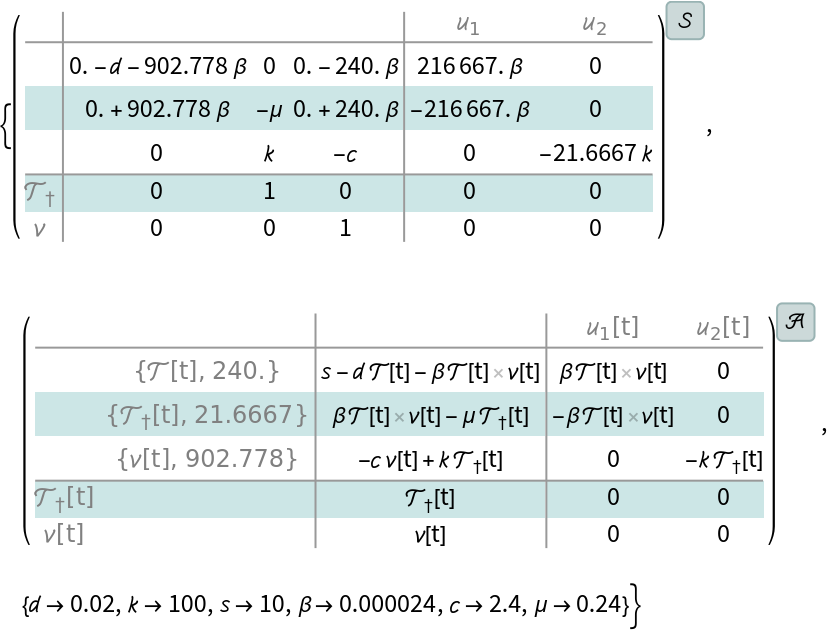
The linear and affine models and their parameters:
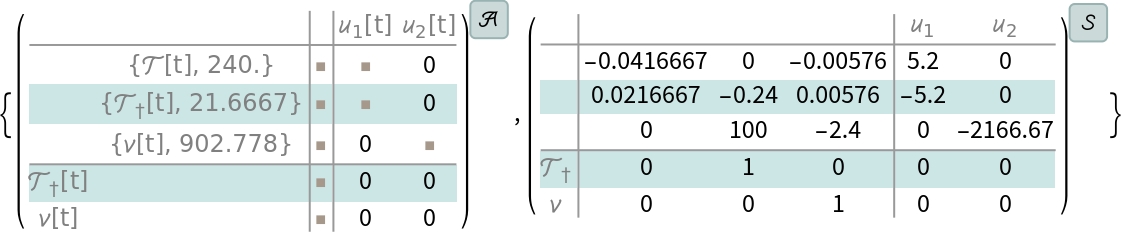
A numerical affine and state space model:
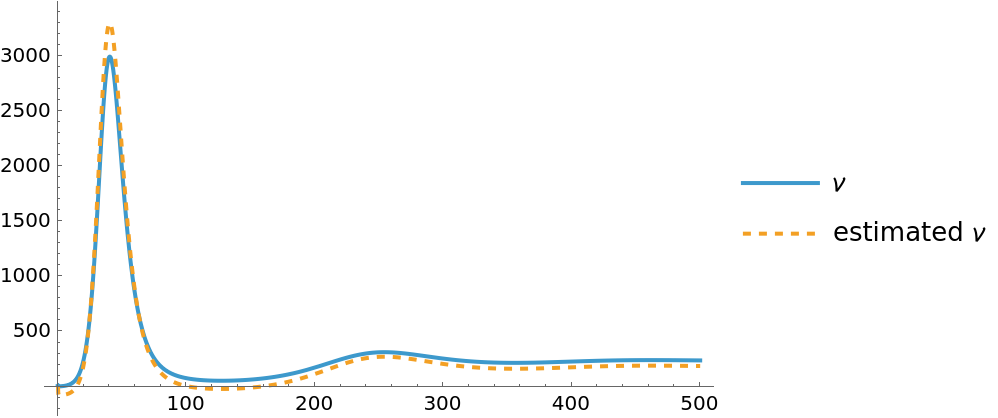
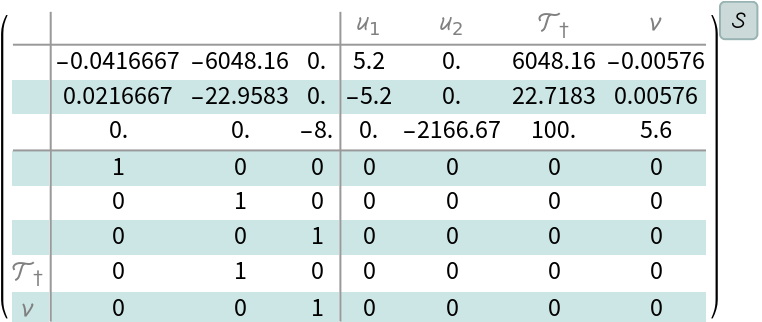
Compute a state-output estimator:
Compare the affine model's virus population to the estimated virus population:
Bibliographic Citation
Suba Thomas,
"HIV Infection Model"
from the Wolfram Data Repository
(2025)
Data Resource History
Publisher Information


![{assm, pars} = Table[ResourceData[\!\(\*
TagBox["\"\<HIV Infection Model\>\"",
#& ,
BoxID -> "ResourceTag-HIV Infection Model-Input",
AutoDelete->True]\), elem], {elem, {"AffineStateSpaceModel", "Parameters"}}];](https://www.wolframcloud.com/obj/resourcesystem/images/c9d/c9d3a760-0a7c-4376-b0e3-129f1d192930/30e86859ac172d4d.png)
![{ssm, assm, pars} = Table[ResourceData[\!\(\*
TagBox["\"\<HIV Infection Model\>\"",
#& ,
BoxID -> "ResourceTag-HIV Infection Model-Input",
AutoDelete->True]\), elem], {elem, {"StateSpaceModel", "AffineStateSpaceModel", "Parameters"}}]](https://www.wolframcloud.com/obj/resourcesystem/images/c9d/c9d3a760-0a7c-4376-b0e3-129f1d192930/0ae746f1140399c4.png)
![or = OutputResponse[{assmn, {1000, 0, 10}}, {0.15, 0.3}, {t, 0, 500}];
orest = OutputResponse[est, Join[{0.15, 0.3}, or], {t, 0, 500}];
Plot[{or[[2]], orest[[3]]}, {t, 0, 500}, Sequence[
PlotRange -> All, PlotStyle -> {Automatic,
Dashing[{Small, Small}]}, PlotLegends -> {"\[ScriptV]", "estimated \[ScriptV]"}]]](https://www.wolframcloud.com/obj/resourcesystem/images/c9d/c9d3a760-0a7c-4376-b0e3-129f1d192930/365fe1753d076577.png)