Wolfram Data Repository
Immediate Computable Access to Curated Contributed Data
Collection of gradient hues from coolHue
| In[1]:= |
| Out[1]= | 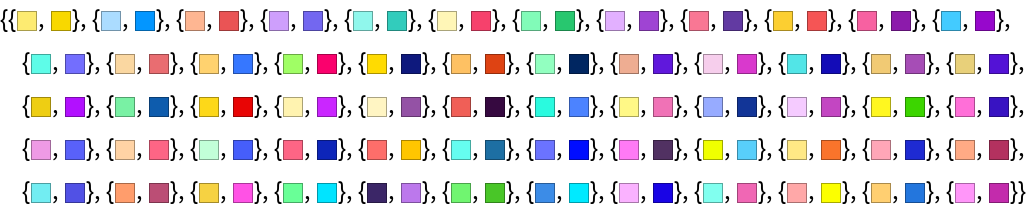 |
Apply a hue gradient filling to a rectangle:
| In[2]:= |
| Out[2]= |  |
Fill from a curve to the axis:
| In[3]:= | ![Plot[2 Sin[x] + x, {x, 0, 15}, FillingStyle -> LinearGradientFilling[ResourceData[\!\(\*
TagBox["\"\<Hue Color Gradients\>\"",
#& ,
BoxID -> "ResourceTag-Hue Color Gradients-Input",
AutoDelete->True]\)][[2]], Top], Filling -> Bottom]](https://www.wolframcloud.com/obj/resourcesystem/images/e52/e520a8b1-6d01-4bd4-9aab-9247b1e4160e/00c0e42d000bd119.png) |
| Out[3]= | 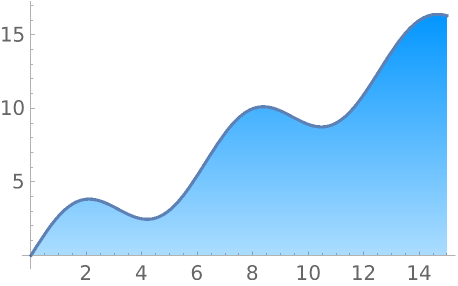 |
| In[4]:= |
| Out[4]= |
| In[5]:= |
| Out[5]= | 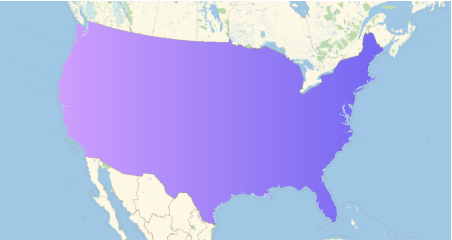 |
Use ConicGradientFilling to style a sector chart:
| In[6]:= |
| Out[6]= |
| In[7]:= |
| Out[7]= | 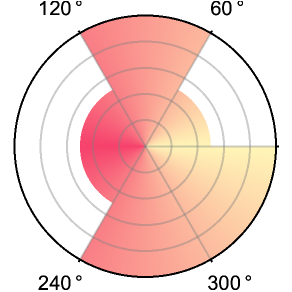 |
Apply a RadialGradientFilling to a rectangle:
| In[8]:= |
| Out[8]= |
| In[9]:= |
| Out[9]= |  |
Wolfram Research, "Hue Color Gradients" from the Wolfram Data Repository (2021)
https://raw.githubusercontent.com/webkul/coolhue/master/LICENSE