Wolfram Data Repository
Immediate Computable Access to Curated Contributed Data
Dataset containing information on all protein coding genes in the Human Protein Protein Interaction Network (PPIN)
| "interactionsOnly" | Association of list of interacting genes |
| "Version 24.0" | Data for all interacting genes in Version 24.0 |
(11351 elements)
Retrieve the full data about genes involved in the human protein protein interaction network:
| In[1]:= |
| Out[1]= | 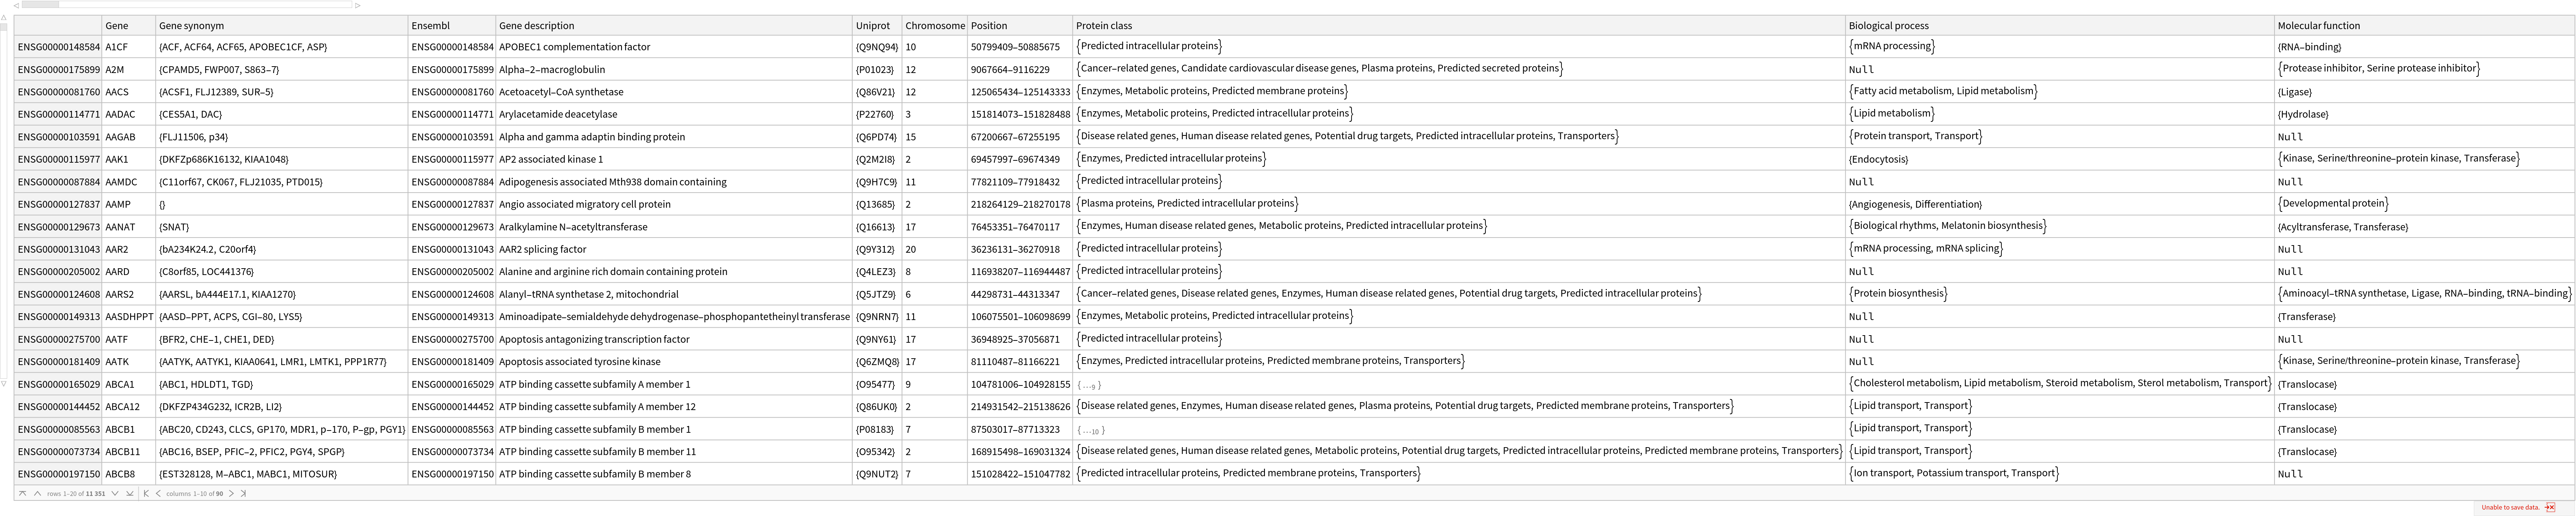 |
Retrieve the keys available for each gene:
| In[2]:= |
| Out[2]= |
Get the dataset of interacting proteins:
| In[3]:= |
| Out[3]= | 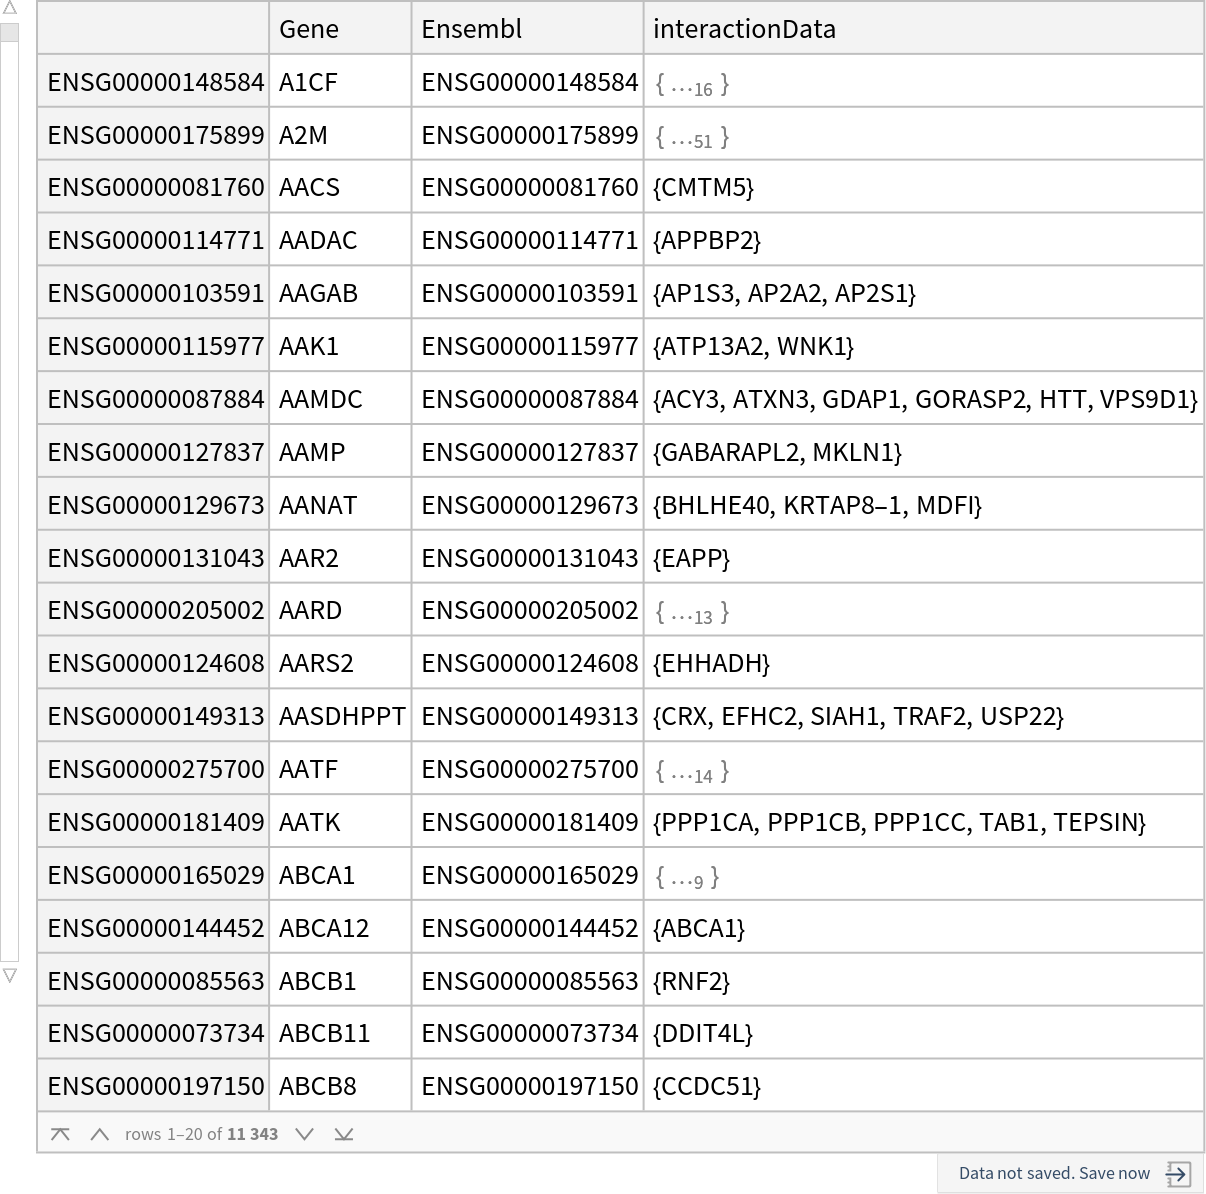 |
Data for Version 24.0 can be accessed using:
| In[4]:= |
| Out[4]= | 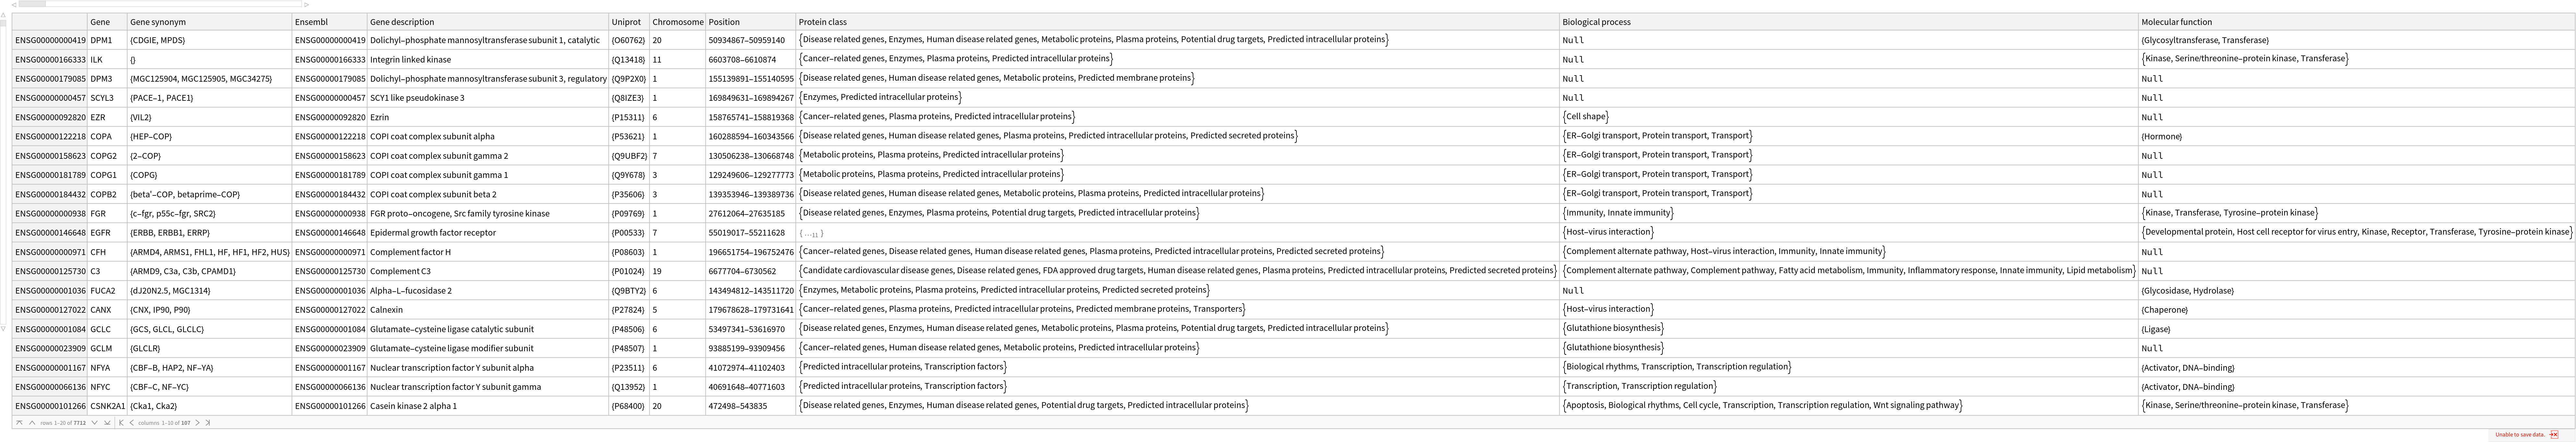 |
Association of the frequency of connection of all interacting proteins:
| In[5]:= | ![connectivitiesAssociation = KeySort@Counts@Values@Map[Length, ResourceData[\!\(\*
TagBox["\"\<Human Protein Protein Interaction Network Genes\>\"",
#& ,
BoxID -> "ResourceTag-Human Protein Protein Interaction Network Genes-Input",
AutoDelete->True]\), "interactionsOnly"][[All, 3]]]](https://www.wolframcloud.com/obj/resourcesystem/images/0f3/0f35e5ca-0629-4810-a382-a528c4be0405/4f215475be009e2a.png) |
| Out[5]= |  |
Visualize the power law nature of the connectivity frequencies in Human PPIN, this implies the human PPIN is a scale-free network with a few large hubs:
| In[6]:= | ![exponent = -2;
fit = 40000*(#^exponent) & /@ Range[200];
exponent2 = -1;
fit2 = 3000*(#^exponent2) & /@ Range[200];
ListLogLogPlot[{connectivitiesAssociation, fit, fit2}, AxesLabel -> {"Connections", "Frequencies"}, ImageSize -> 600, PlotLegends -> {"Data", "x^-2", "x^-1"}]](https://www.wolframcloud.com/obj/resourcesystem/images/0f3/0f35e5ca-0629-4810-a382-a528c4be0405/5cb745a2b74ad2b6.png) |
| Out[10]= | 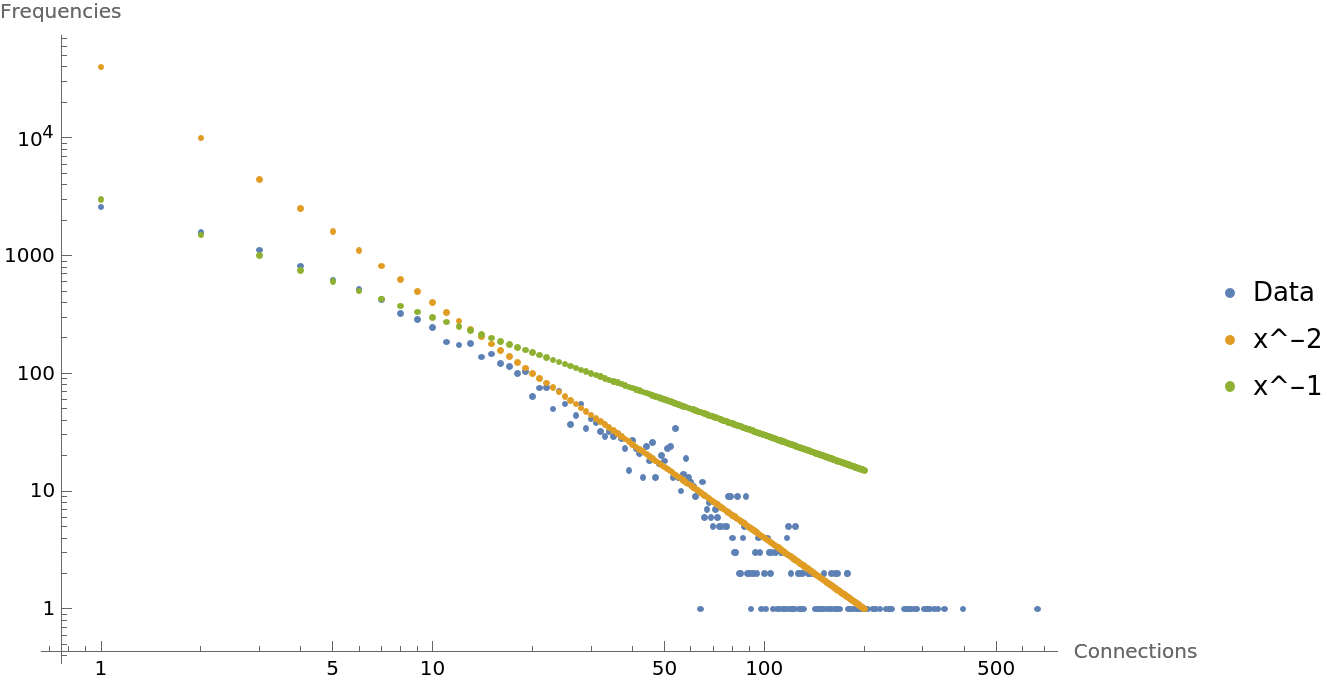 |
Let us visualize the most important proteins in the human protein protein interaction network in a word cloud:
| In[11]:= | ![fullData = ResourceData[\!\(\*
TagBox["\"\<Human Protein Protein Interaction Network Genes\>\"",
#& ,
BoxID -> "ResourceTag-Human Protein Protein Interaction Network Genes-Input",
AutoDelete->True]\)]; interactions = ResourceData[\!\(\*
TagBox["\"\<Human Protein Protein Interaction Network Genes\>\"",
#& ,
BoxID -> "ResourceTag-Human Protein Protein Interaction Network Genes-Input",
AutoDelete->True]\), "interactionsOnly"]; geneConnectionsCount = Map[Length, Values@interactions[[All, 3]]];
genes = Values@interactions[[All, 1]];
geneGeneNameAssociation = AssociationThread[Values@fullData[[All, 1]],
Values@fullData[[All, 4]]];
geneNames = Map[geneGeneNameAssociation, genes];](https://www.wolframcloud.com/obj/resourcesystem/images/0f3/0f35e5ca-0629-4810-a382-a528c4be0405/5339b0bfedccbad2.png) |
| In[12]:= | ![GraphicsRow[{WordCloud[
MapThread[{#1, #2} &, {genes, geneConnectionsCount}], PlotLabel -> Style["Genes", Black, 30], ColorFunction -> "Rainbow",
ImageSize -> 500],
WordCloud[MapThread[{#1, #2} &, {geneNames, geneConnectionsCount}], PlotLabel -> Style["Gene names", Black, 30], ColorFunction -> "Rainbow", ImageSize -> 600]}, ImageSize -> 1000]](https://www.wolframcloud.com/obj/resourcesystem/images/0f3/0f35e5ca-0629-4810-a382-a528c4be0405/3692393a439c9dbe.png) |
| Out[12]= | 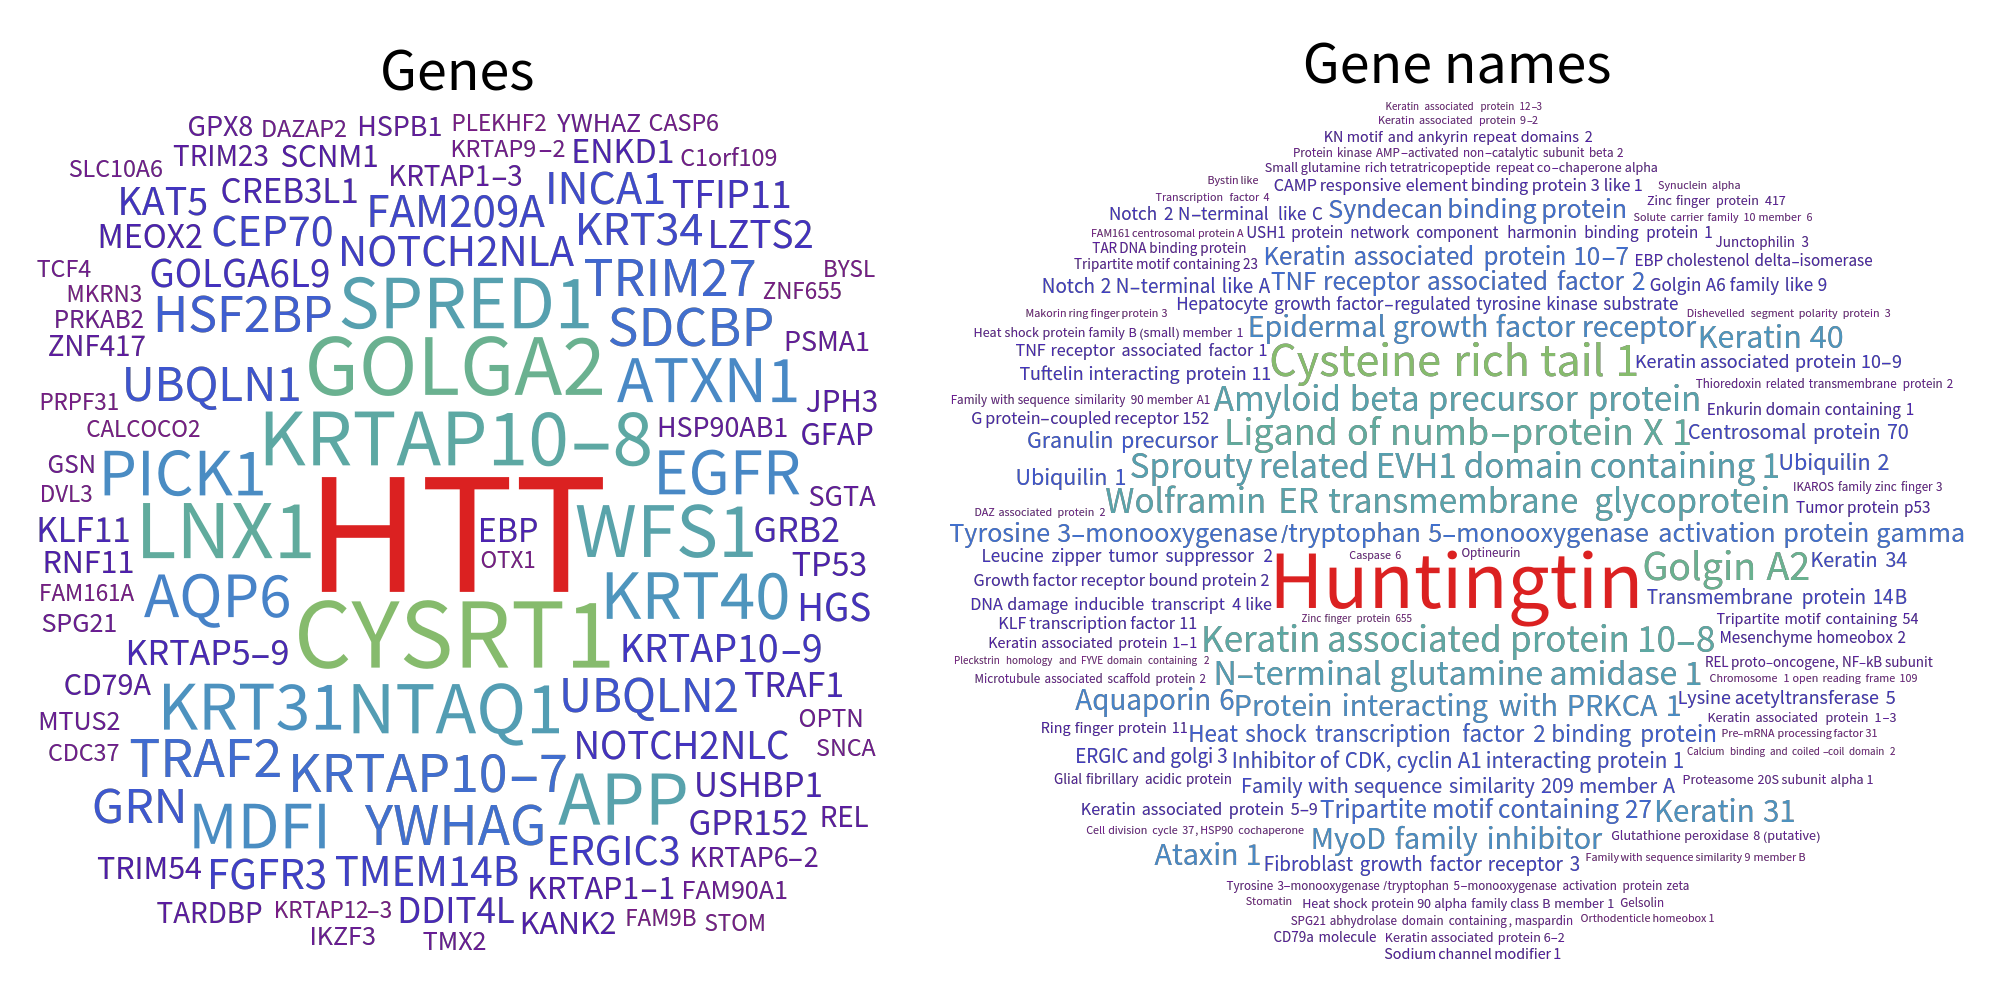 |
We can also analyze the genes based on other characteristics, such as the chromosome each of them appears on:
| In[13]:= | ![chromosomeCounts = SortBy[Normal[
Counts[Table[
element["Chromosome"], {element, Values[fullData]}]]], {If[
NumericQ[ToExpression[First[#]]], ToExpression[First[#]], 100 + Position[{"X", "Y", "MT"}, First[#]][[1, 1]]], Last[#]} &];
PieChart[Values[chromosomeCounts], ChartLabels -> Callout[Keys[chromosomeCounts]], PlotLabel -> Style["Distribution of Genes by Chromosome", Black, 15],
ImageSize -> 600, ColorFunction -> "DarkRainbow"]](https://www.wolframcloud.com/obj/resourcesystem/images/0f3/0f35e5ca-0629-4810-a382-a528c4be0405/3bb94800da688331.png) |
| Out[14]= | 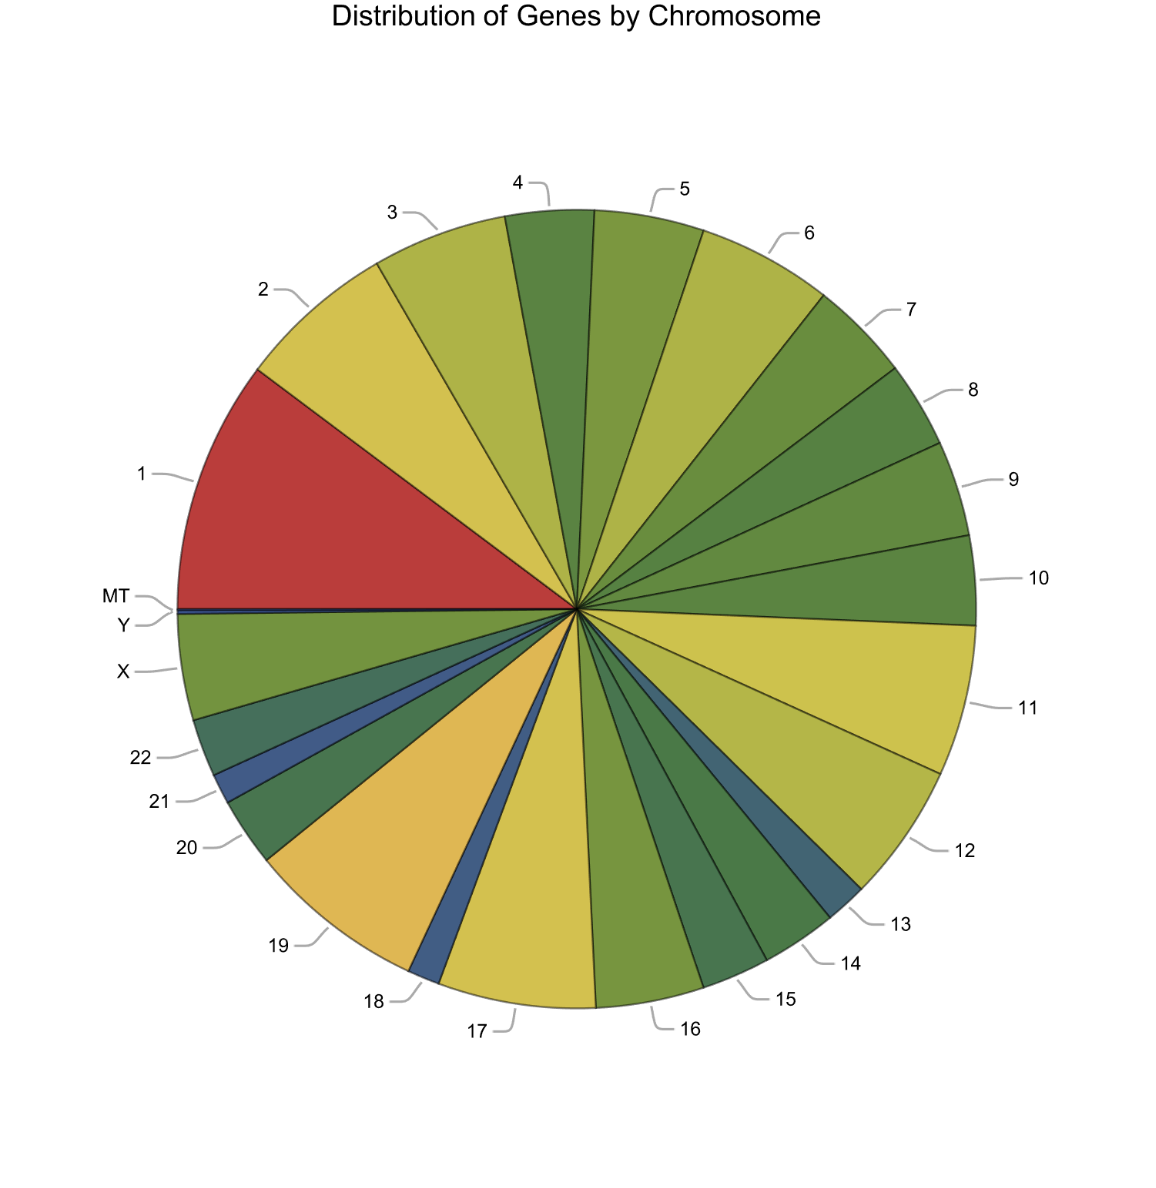 |
WolframChemistry, "Human Protein Protein Interaction Network Genes" from the Wolfram Data Repository (2024)