Wolfram Data Repository
Immediate Computable Access to Curated Contributed Data
Contributions to the Set.mm database
| In[1]:= |
| Out[32]= | 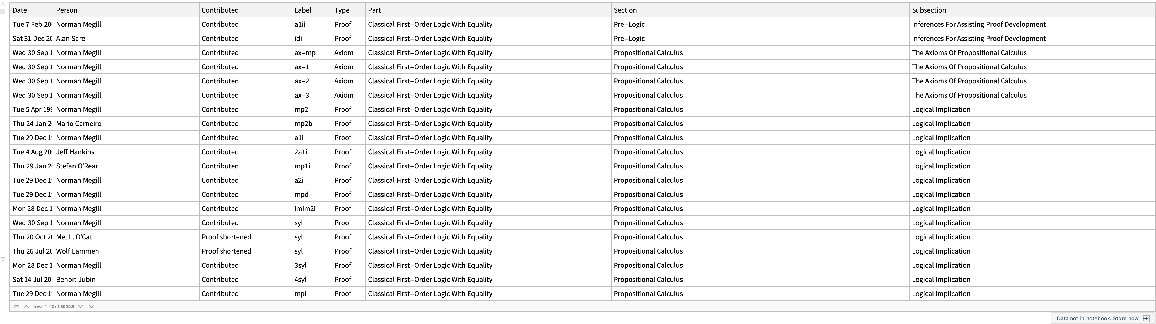 |
Number of contributions by people:
| In[33]:= | ![ResourceData[\!\(\*
TagBox["\"\<Metamath Report\>\"",
#& ,
BoxID -> "ResourceTag-Metamath Report-Input",
AutoDelete->True]\)][
BarChart[Take[Sort@Counts[#], -20], BarOrigin -> Left, ChartLabels -> Automatic, ImageSize -> Large] &, "Person"]](https://www.wolframcloud.com/obj/resourcesystem/images/8dc/8dc74a41-0419-4945-a15e-8631c90d60e5/43cf79f23d953ad7.png) |
| Out[33]= | 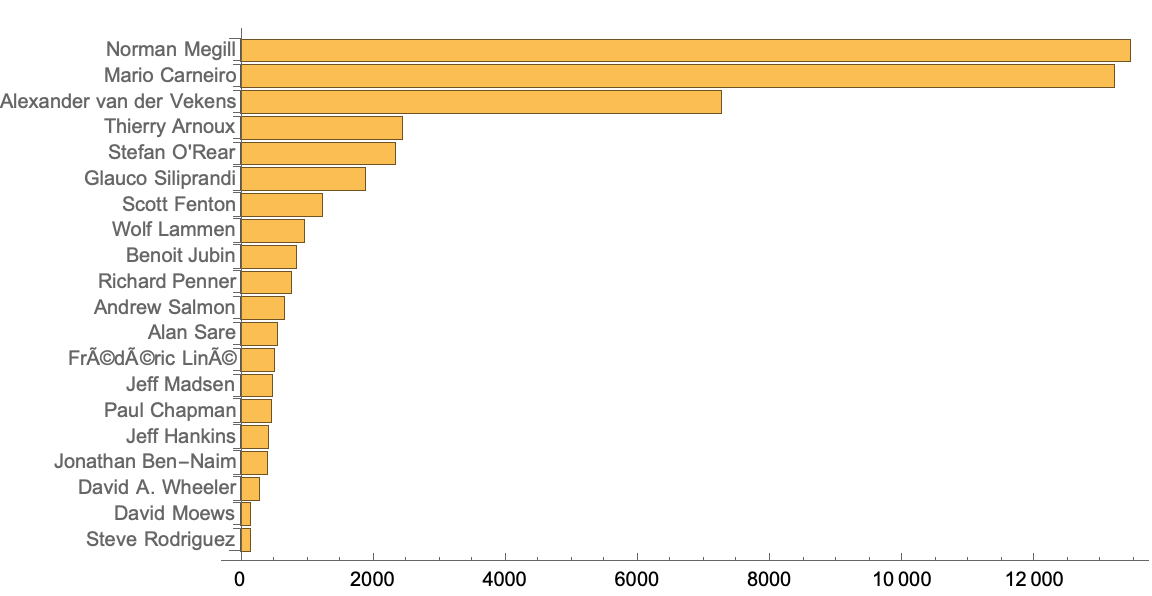 |
Total number of contributions by year:
| In[34]:= |
| Out[34]= | 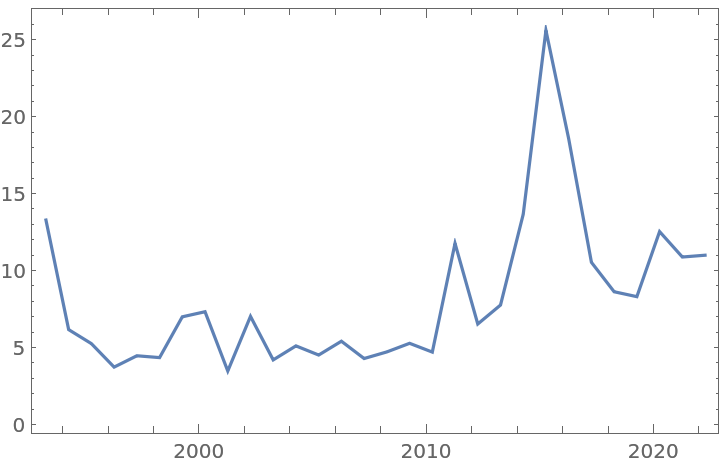 |
Number of contributions to different parts of mathematics by year:
| In[35]:= | ![ResourceData[\!\(\*
TagBox["\"\<Metamath Report\>\"",
#& ,
BoxID -> "ResourceTag-Metamath Report-Input",
AutoDelete->True]\)][All, {DateObject[#Date, "Year"], #Part} &][
GroupBy[First]/*KeySort, Map[Last]/*Counts][
BarChart[#, ChartLayout -> "Stacked", ChartStyle -> "Pastel", Frame -> True, FrameTicks -> {{Automatic, None}, {MapIndexed[{First[#2], DateValue[#1, "YearShort"]} &, Keys@#], None}}, ChartLegends -> DeleteDuplicates[Join @@ Keys@Values[#]]] &]](https://www.wolframcloud.com/obj/resourcesystem/images/8dc/8dc74a41-0419-4945-a15e-8631c90d60e5/442ba1065e1cd023.png) |
| Out[35]= | 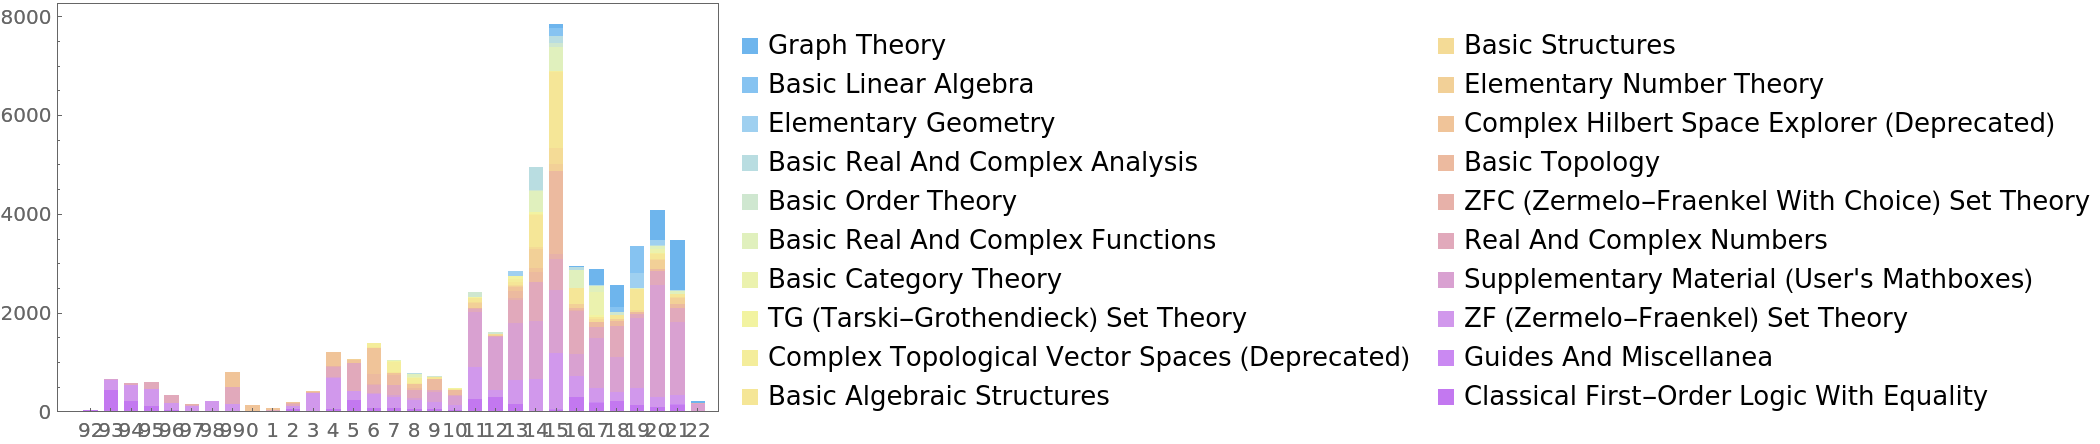 |
Wolfram Research, "Metamath Report" from the Wolfram Data Repository (2022)