Details
The Mexico City subway network, officially known as the "Sistema de Transporte Colectivo" (STC) or the Mexico City Metro, is the network of interconnected subway lines that serves the metropolitan area of Mexico City and some municipalities in the State of Mexico.
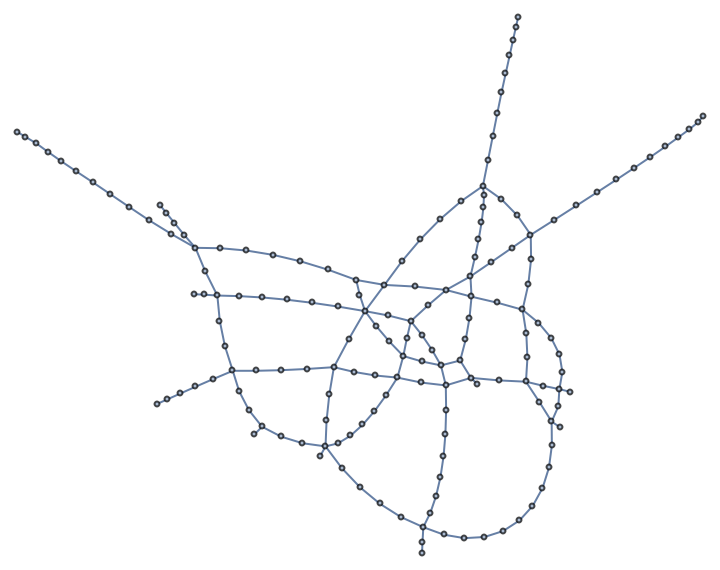
Each subway station is a vertex, and the connections between stations are represented as edges (163 vertices, 183 edges)
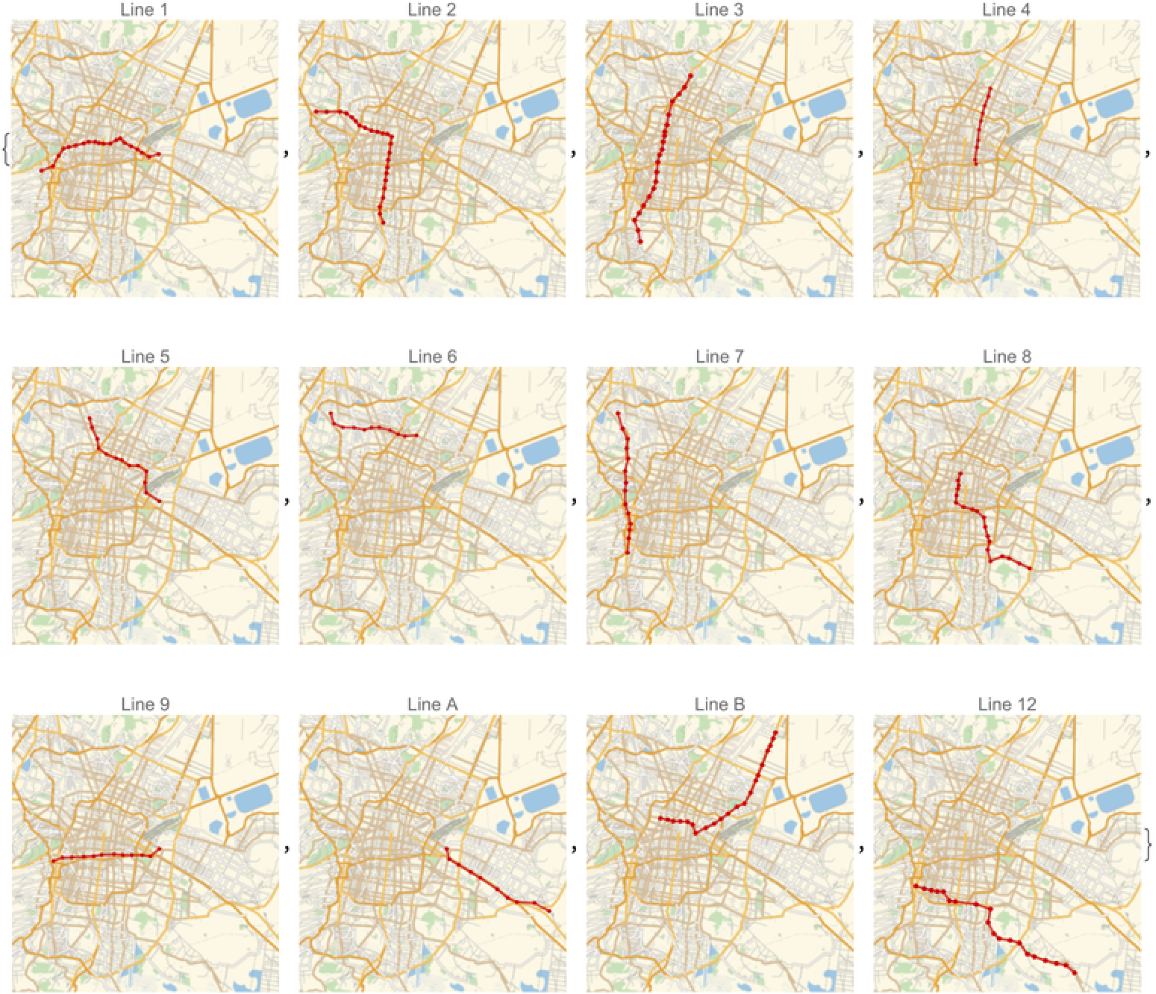
The subway lines are numbered from 1 to 9, A, B, and 12.
Geolocation data is incorporated into the vertices to represent the precise positions of each station.
Information about passenger usage is represented as weights of the vertices. It's noteworthy that some stations have a weight of zero, such as those on line 1, which is undergoing maintenance, and those on line 12, that had an incident on 2021.
![Graph[ResourceData[\!\(\*
TagBox["\"\<Mexico City Subway Network\>\"",
#& ,
BoxID -> "ResourceTag-Mexico City Subway Network-Input",
AutoDelete->True]\), "Line 1"], EdgeStyle -> ResourceData[\!\(\*
TagBox["\"\<Mexico City Subway Network\>\"",
#& ,
BoxID -> "ResourceTag-Mexico City Subway Network-Input",
AutoDelete->True]\), "Colors"], VertexStyle -> White]](https://www.wolframcloud.com/obj/resourcesystem/images/126/126f4018-cf64-4635-b4d6-8b0932513648/16bccbcc90cc8908.png)
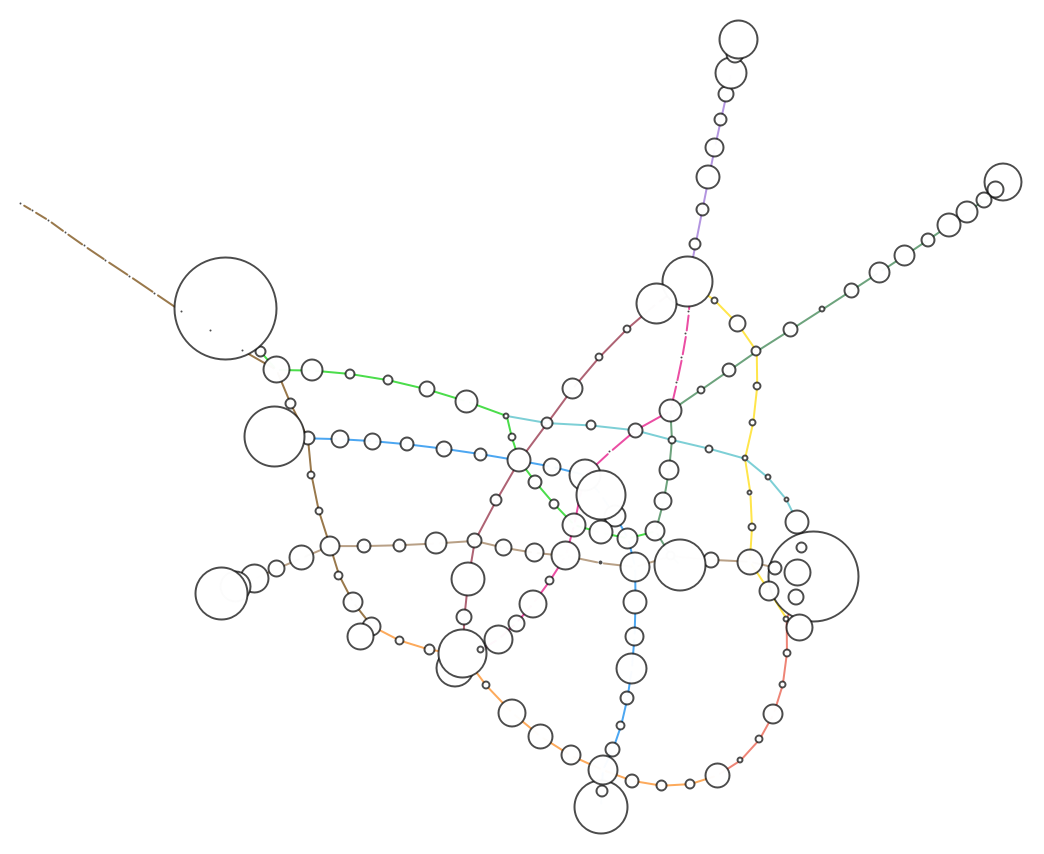
![Graph[g, VertexSize -> Thread[VertexList[g] -> (VertexDegree[g]/Median[VertexDegree[g]])], GraphLayout -> "RadialEmbedding", EdgeStyle -> ResourceData[\!\(\*
TagBox["\"\<Mexico City Subway Network\>\"",
#& ,
BoxID -> "ResourceTag-Mexico City Subway Network-Input",
AutoDelete->True]\), "Colors"]]](https://www.wolframcloud.com/obj/resourcesystem/images/126/126f4018-cf64-4635-b4d6-8b0932513648/51c9226d8fb522ae.png)
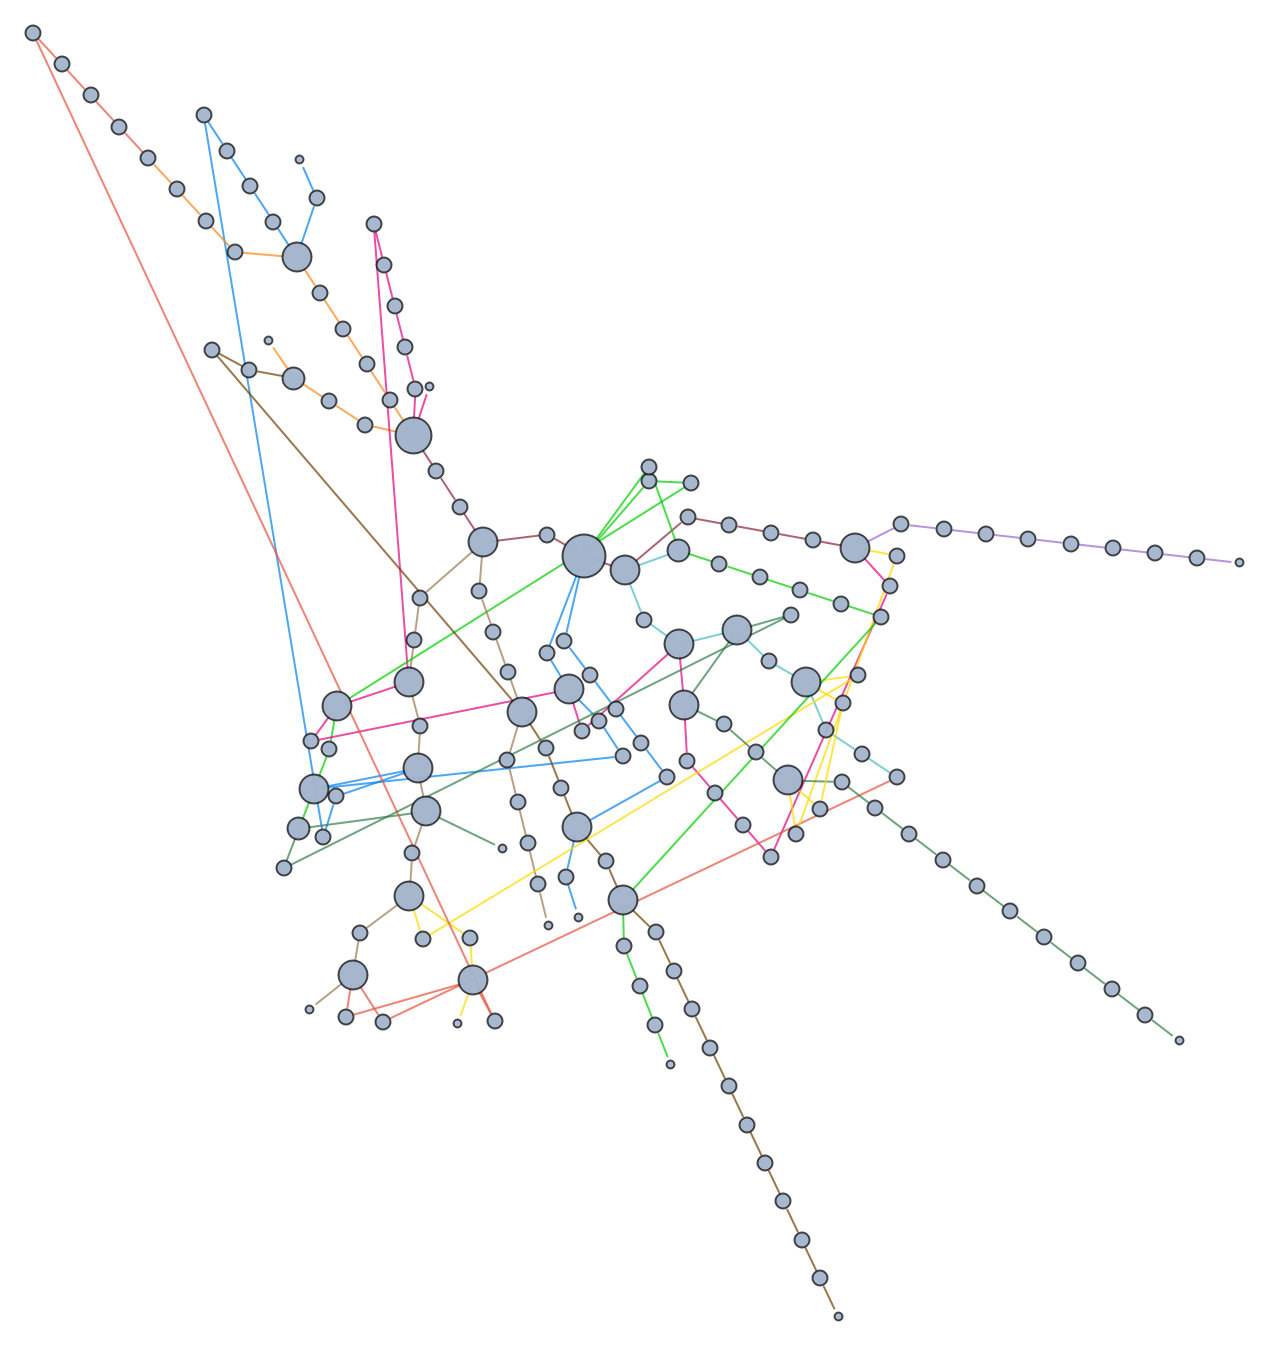
![Graph[g, VertexSize -> Map[# /. (x_ -> y_) :> (x -> y/1000000) &, ResourceData[\!\(\*
TagBox["\"\<Mexico City Subway Network\>\"",
#& ,
BoxID -> "ResourceTag-Mexico City Subway Network-Input",
AutoDelete->True]\), "VertexWeight"]], EdgeStyle -> ResourceData[\!\(\*
TagBox["\"\<Mexico City Subway Network\>\"",
#& ,
BoxID -> "ResourceTag-Mexico City Subway Network-Input",
AutoDelete->True]\), "Colors"], VertexStyle -> White]](https://www.wolframcloud.com/obj/resourcesystem/images/126/126f4018-cf64-4635-b4d6-8b0932513648/5cb7cff7be5a5123.png)
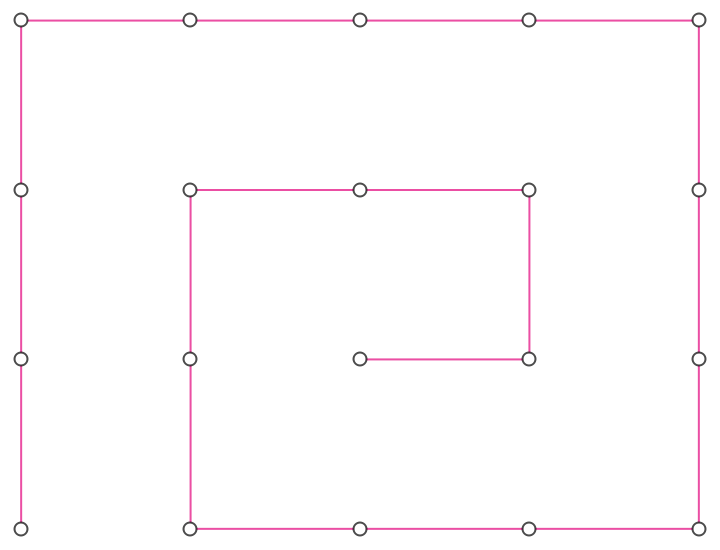
![GeoGraphPlot[EdgeList[ResourceData[\!\(\*
TagBox["\"\<Mexico City Subway Network\>\"",
#& ,
BoxID -> "ResourceTag-Mexico City Subway Network-Input",
AutoDelete->True]\)]] /. ResourceData[\!\(\*
TagBox["\"\<Mexico City Subway Network\>\"",
#& ,
BoxID -> "ResourceTag-Mexico City Subway Network-Input",
AutoDelete->True]\), "GeoPositions"]]](https://www.wolframcloud.com/obj/resourcesystem/images/126/126f4018-cf64-4635-b4d6-8b0932513648/68ad963fe8c0ee8e.png)

![indgraph2 = GeoGraphPlot[EdgeList[ResourceData[\!\(\*
TagBox["\"\<Mexico City Subway Network\>\"",
#& ,
BoxID -> "ResourceTag-Mexico City Subway Network-Input",
AutoDelete->True]\), #]] /. ResourceData[\!\(\*
TagBox["\"\<Mexico City Subway Network\>\"",
#& ,
BoxID -> "ResourceTag-Mexico City Subway Network-Input",
AutoDelete->True]\), "GeoPositions"], GeoRange -> {GeoPosition[{19.53983345875487, -99.22046756934368}],
GeoPosition[{19.279964832166694`, -98.95502497470883}]}, PlotLabel -> #] & /@ {"Line 1", "Line 2", "Line 3", "Line 4", "Line 5", "Line 6", "Line 7", "Line 8", "Line 9", "Line A", "Line B", "Line 12"}](https://www.wolframcloud.com/obj/resourcesystem/images/126/126f4018-cf64-4635-b4d6-8b0932513648/4b6ca1add644494a.png)