Wolfram Data Repository
Immediate Computable Access to Curated Contributed Data
Power density in various systems in the universe for a comparison of their thermodynamics efficiency
Data includes the computed metabolic rate across the ranges of species (Prokaryotes, Protists, Metazoans) and the estimated power (energy rate) density in biological and astronomical systems for a comparison of their thermodynamics efficiency.
(7 columns, 318 rows)
Retrieve the default content:
| In[1]:= |
| Out[1]= | 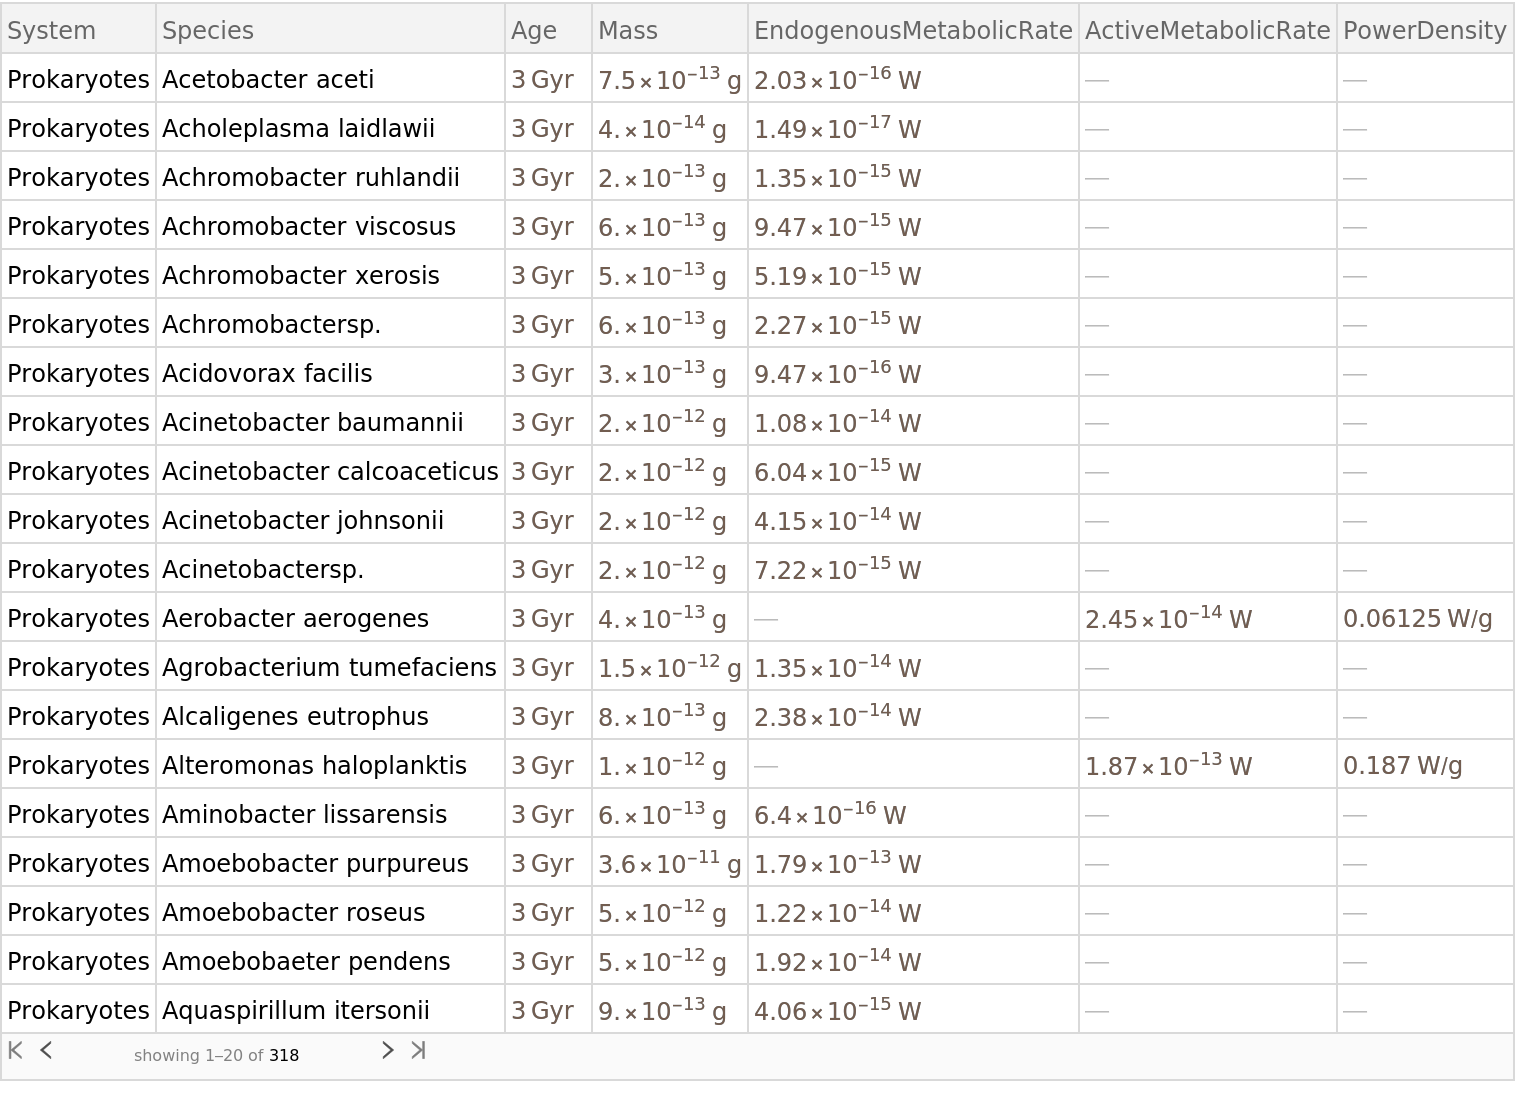 |
Plot the power density of various systems (biological/astronomical) in the universe as a function of their age (from their origin):
| In[2]:= | ![ListLogPlot[
ResourceData["Power Density in Biological and Astronomical Systems"][
GroupBy["System"], Mean, {"Age", "PowerDensity"}], PlotTheme -> "Business", FrameLabel -> {{"Power density (W/g)", Automatic}, {"Age (Gya)", Automatic}}]](https://www.wolframcloud.com/obj/resourcesystem/images/d7d/d7d67ce4-9df3-472f-85d2-186ce42ffddd/5cdcb8537b9ecb62.png) |
| Out[2]= | 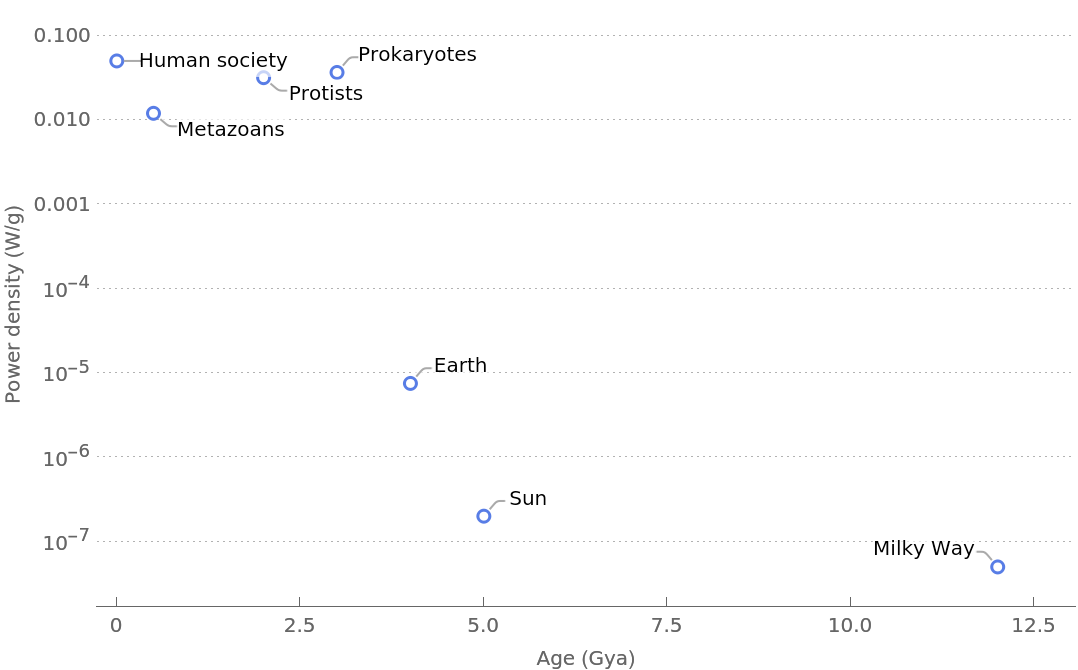 |
Plot the relationship between mass and endogenous/active metabolic rates for Protists species:
| In[3]:= | ![findFit[fitdata_] := Block[{lm, coeff}, lm = LinearModelFit[
Log10[Values@Normal@fitdata /. q_Quantity :> First@q], x, x]; coeff = First@Transpose@lm["ParameterTableEntries"]; 10^#1 x^#2 & @@ coeff]
Block[{data, endogMR, activeMR, endogFit, activeFit},
data = ResourceData[
"Power Density in Biological and Astronomical Systems"][
Select[MatchQ[#System, "Protists"] &]];
endogMR = data[Select[MatchQ[#EndogenousMetabolicRate, _Quantity] &], {"Mass",
"EndogenousMetabolicRate"}];
activeMR = data[Select[MatchQ[#ActiveMetabolicRate, _Quantity] &], {"Mass", "ActiveMetabolicRate"}];
endogFit = findFit[endogMR];
activeFit = findFit[activeMR];
Show[ListLogLogPlot[endogMR, PlotStyle -> Blue, PlotTheme -> "Business", PlotLegends -> {"Endogenous metabolic rate"}], ListLogLogPlot[activeMR, PlotStyle -> Orange, PlotTheme -> "Business", PlotLegends -> {"Active metabolic rate"}],
LogLogPlot[endogFit, {x, 10^-12, 10^-3}, PlotStyle -> Blue], LogLogPlot[activeFit, {x, 10^-12, 10^-3}, PlotStyle -> Orange], FrameLabel -> {{"Metabolic rate (W)", Automatic}, {"Mass (g)", Automatic}}]]](https://www.wolframcloud.com/obj/resourcesystem/images/d7d/d7d67ce4-9df3-472f-85d2-186ce42ffddd/58aa709092124354.png) |
| Out[3]= | 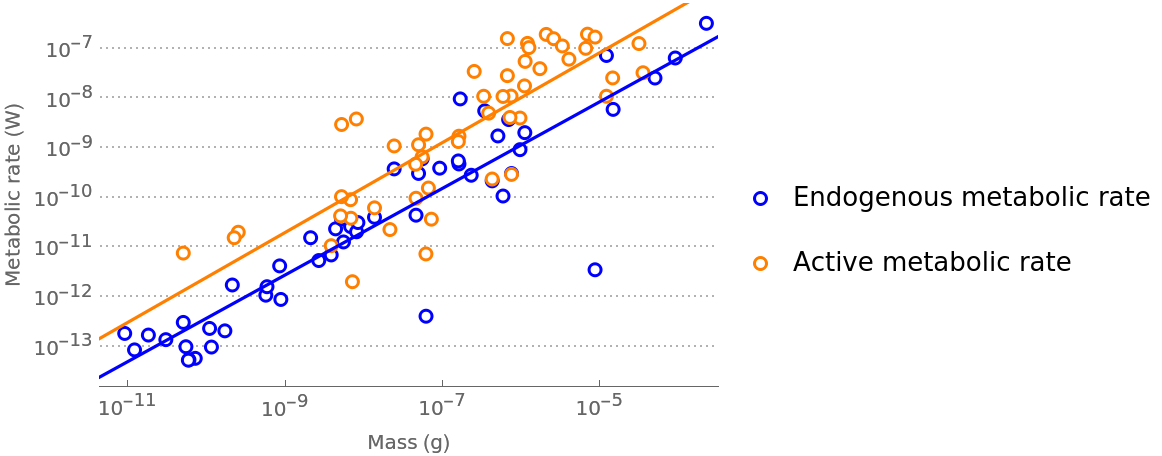 |
Wolfram Research, "Power Density in Biological and Astronomical Systems" from the Wolfram Data Repository (2017) https://doi.org/10.24097/wolfram.08307.data