Wolfram Data Repository
Immediate Computable Access to Curated Contributed Data
Rainfall seeding data
Originator: John M. Chambers, et al.
(2 columns, 52 rows)
Retrieve the ResourceObject:
| In[1]:= |
| Out[1]= |  |
View the data:
| In[2]:= |
| Out[2]= | 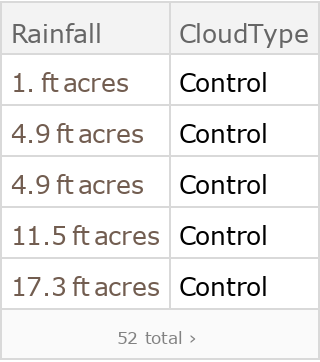 |
Compare mean rainfall amounts for control and seeded clouds:
| In[3]:= | ![BarChart[Mean /@ GroupBy[ResourceData[
"Sample Data: Rainfall Seeding"], #CloudType &][All, All, "Rainfall"], ChartLabels -> Automatic, AxesLabel -> Automatic]](https://www.wolframcloud.com/obj/resourcesystem/images/53f/53ff7f90-4814-406e-b20f-359cf1c06e59/571159b1997f9222.png) |
| Out[3]= | 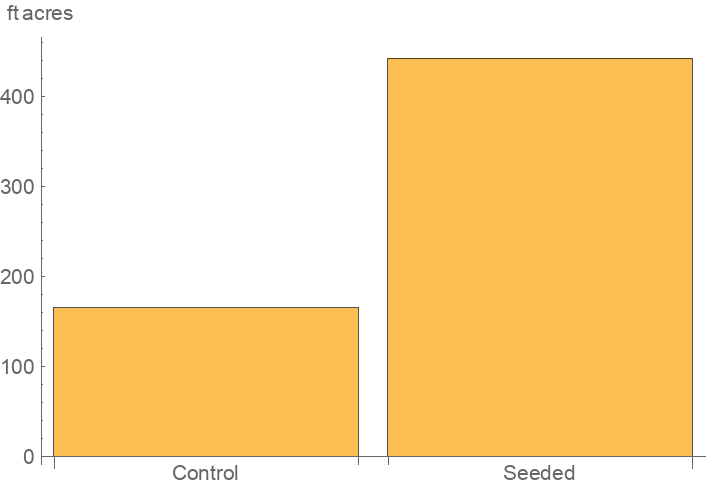 |
Wolfram Research, "Sample Data: Rainfall Seeding" from the Wolfram Data Repository (2016) https://doi.org/10.24097/wolfram.64663.data