Wolfram Data Repository
Immediate Computable Access to Curated Contributed Data
Locations of scallop samples in the Atlantic Ocean, annotated with the numbers and types of scallops caught
| In[1]:= |
| Out[1]= |  |
Summary of the spatial point data:
| In[2]:= |
| Out[2]= |  |
Plot the spatial point data:
| In[3]:= |
| Out[3]= | 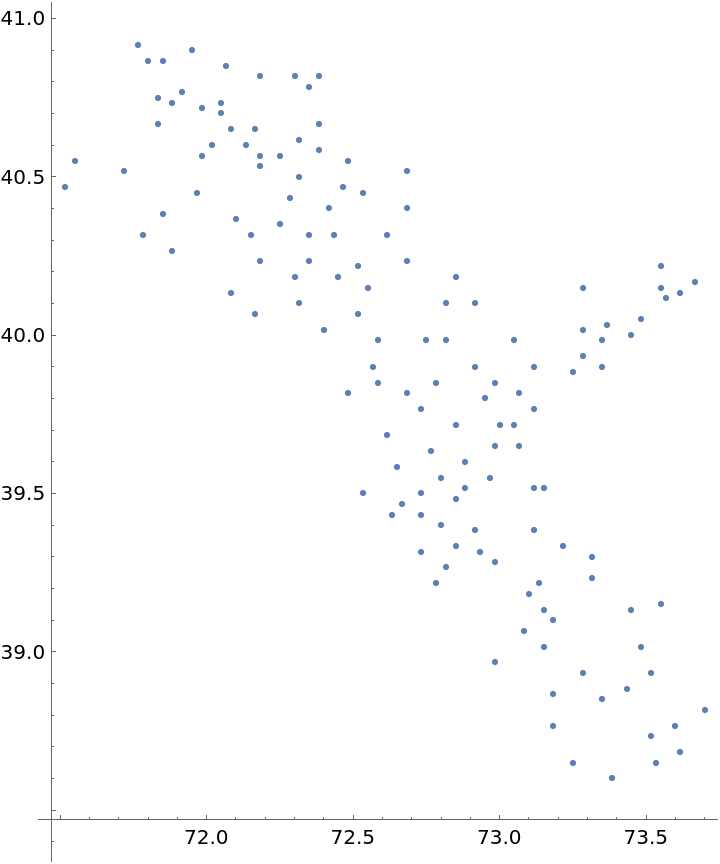 |
Visualize the data with some annotations:
| In[4]:= |
| Out[4]= | 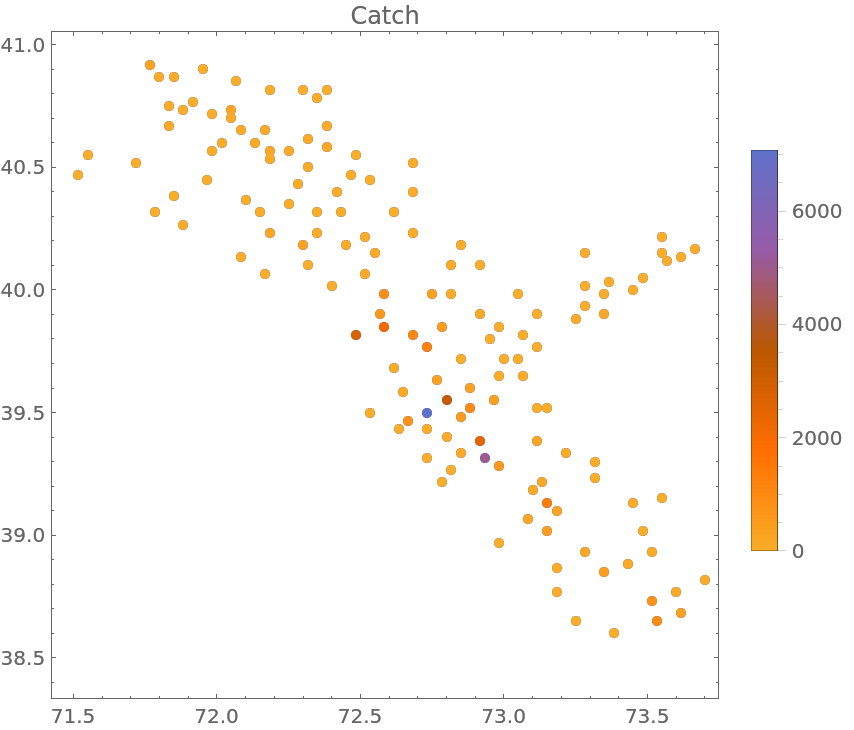 |
Visualize the smooth point density of the data:
| In[5]:= |
| Out[5]= |  |
| In[6]:= | ![Show[ContourPlot[density[{x, y}], {x, y} \[Element] ResourceData[\!\(\*
TagBox["\"\<Sample Data: Scallop Abundance\>\"",
#& ,
BoxID -> "ResourceTag-Sample Data: Scallop Abundance-Input",
AutoDelete->True]\), "ObservationRegion"], ColorFunction -> "Rainbow"], ListPlot[ResourceData[\!\(\*
TagBox["\"\<Sample Data: Scallop Abundance\>\"",
#& ,
BoxID -> "ResourceTag-Sample Data: Scallop Abundance-Input",
AutoDelete->True]\), "Data"], PlotStyle -> Black]]](https://www.wolframcloud.com/obj/resourcesystem/images/44a/44ae0373-b1b7-4ea4-915c-c7a480192026/4ec9a9ec8312a92f.png) |
| Out[6]= | 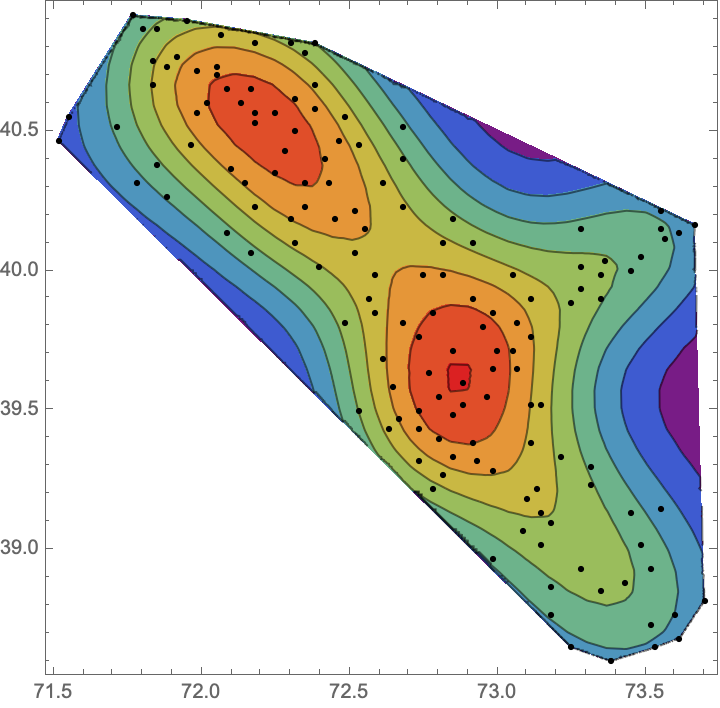 |
Use SpatialEstimate to create an estimate of recruit percentage from sparse catch locations. First select locations with positive catch numbers:
| In[7]:= |
| In[8]:= |
Compute rate of recruits relative to the catch size:
| In[9]:= | ![recruitsRate = Extract[ResourceData[\!\(\*
TagBox["\"\<Sample Data: Scallop Abundance\>\"",
#& ,
BoxID -> "ResourceTag-Sample Data: Scallop Abundance-Input",
AutoDelete->True]\), "Annotations"]["Recruits"], pos]/
Extract[ResourceData[\!\(\*
TagBox["\"\<Sample Data: Scallop Abundance\>\"",
#& ,
BoxID -> "ResourceTag-Sample Data: Scallop Abundance-Input",
AutoDelete->True]\), "Annotations"]["Catch"], pos] // N;](https://www.wolframcloud.com/obj/resourcesystem/images/44a/44ae0373-b1b7-4ea4-915c-c7a480192026/351ea80e03b81e97.png) |
Compute spatial prediction:
| In[10]:= |
| Out[10]= |  |
| In[11]:= |
Visualize the recruits rates over the whole observation region:
| In[12]:= | ![Row@{PointValuePlot[locs -> recruitsRate, ColorFunction -> "Rainbow", PlotLegends -> Automatic, PlotLabel -> "recruits rates"], PointValuePlot[pts -> vals, PlotStyle -> PointSize[Medium], ColorFunction -> "Rainbow", PlotLabel -> "estimated recruits rates"]}](https://www.wolframcloud.com/obj/resourcesystem/images/44a/44ae0373-b1b7-4ea4-915c-c7a480192026/6d6befcab160ab2a.png) |
| Out[12]= | 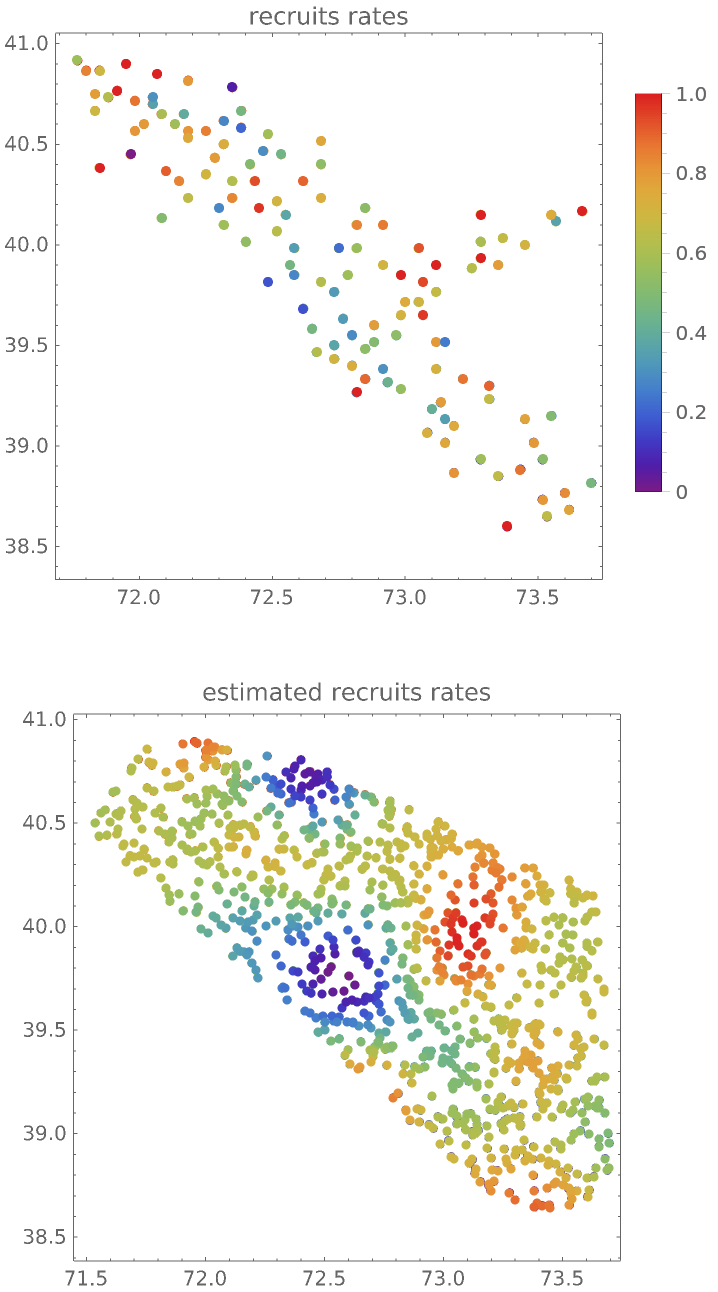 |
Gosia Konwerska, "Sample Data: Scallop Abundance" from the Wolfram Data Repository (2022)