Wolfram Data Repository
Immediate Computable Access to Curated Contributed Data
Locations of Shapley supercluster galaxies annotated with magnitude, velocity (in km/s), and error marks
Retrieve the data:
| In[1]:= |
| Out[1]= | 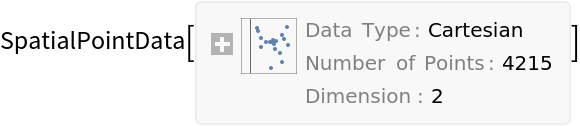 |
Summary of the spatial point data:
| In[2]:= |
| Out[2]= | 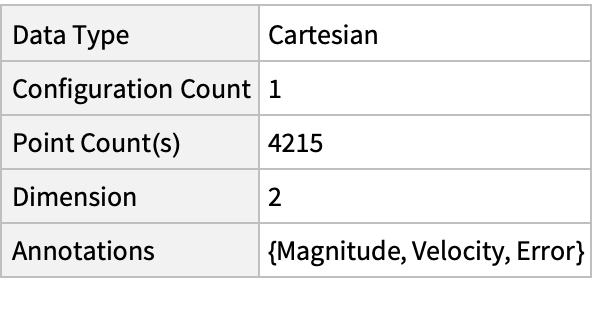 |
Plot the spatial point data:
| In[3]:= |
| Out[3]= | 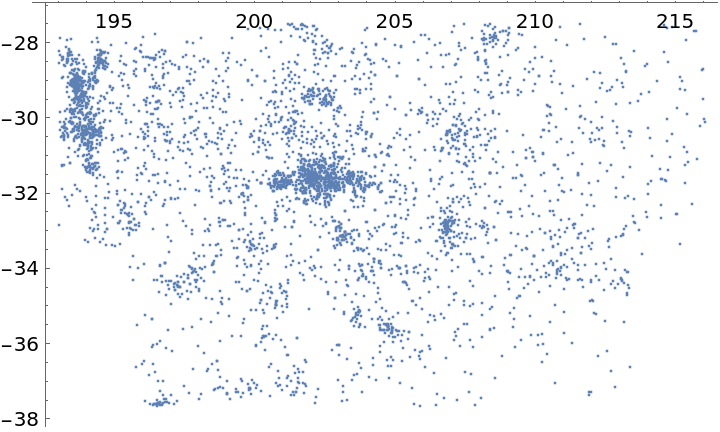 |
Visualize the points with magnitude annotations:
| In[4]:= | ![PointValuePlot[ResourceData[\!\(\*
TagBox["\"\<Sample Data: Shapley Supercluster Galaxies\>\"",
#& ,
BoxID -> "ResourceTag-Sample Data: Shapley Supercluster Galaxies-Input",
AutoDelete->True]\), "Data"], {1 -> "Color", 2 -> None, 3 -> None}, ColorFunction -> "TemperatureMap", Background -> Black, PlotLegends -> Automatic]](https://www.wolframcloud.com/obj/resourcesystem/images/03b/03bb5e97-34ae-4662-a591-07f29f067ffc/2a4cb6b312d8e56e.png) |
| Out[4]= |  |
Visualize the smooth point density of the data:
| In[5]:= | ![density = SmoothPointDensity[ResourceData[\!\(\*
TagBox["\"\<Sample Data: Shapley Supercluster Galaxies\>\"",
#& ,
BoxID -> "ResourceTag-Sample Data: Shapley Supercluster Galaxies-Input",
AutoDelete->True]\), "Data"]]](https://www.wolframcloud.com/obj/resourcesystem/images/03b/03bb5e97-34ae-4662-a591-07f29f067ffc/2b006c8512ed4a49.png) |
| Out[5]= | 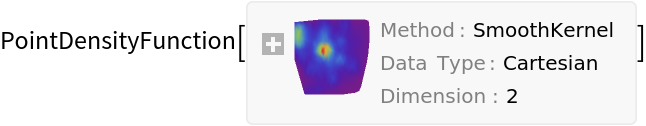 |
| In[6]:= | ![Show[ContourPlot[density[{x, y}], {x, y} \[Element] ResourceData[\!\(\*
TagBox["\"\<Sample Data: Shapley Supercluster Galaxies\>\"",
#& ,
BoxID -> "ResourceTag-Sample Data: Shapley Supercluster Galaxies-Input",
AutoDelete->True]\), "ObservationRegion"], ColorFunction -> "Rainbow"], ListPlot[ResourceData[\!\(\*
TagBox["\"\<Sample Data: Shapley Supercluster Galaxies\>\"",
#& ,
BoxID -> "ResourceTag-Sample Data: Shapley Supercluster Galaxies-Input",
AutoDelete->True]\), "Data"], PlotStyle -> Black]]](https://www.wolframcloud.com/obj/resourcesystem/images/03b/03bb5e97-34ae-4662-a591-07f29f067ffc/46fe01b253bc207f.png) |
| Out[6]= | 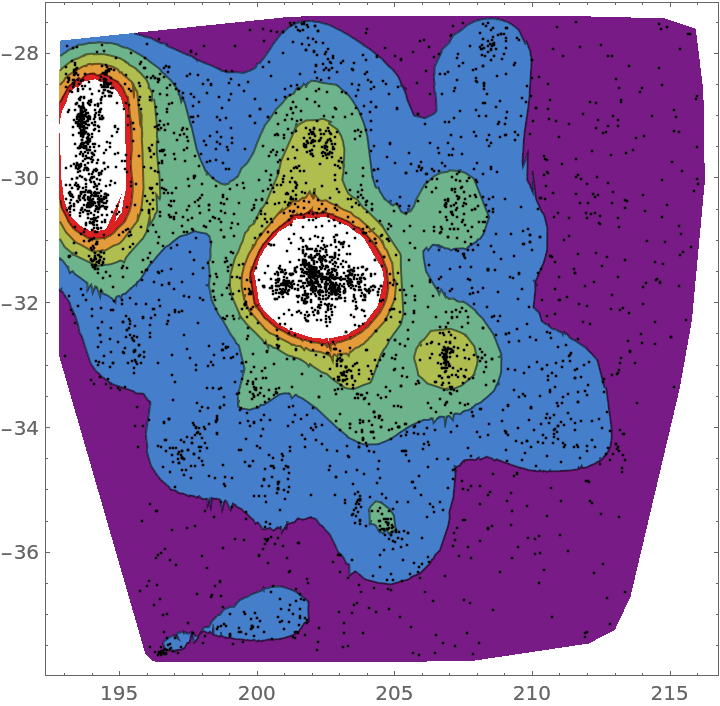 |
Compute probability of finding a point within given radius of an existing point - NearestNeighborG is the CDF of the nearest neighbor distribution:
| In[7]:= |
| Out[7]= | 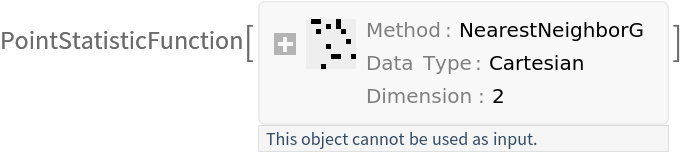 |
| In[8]:= |
| Out[8]= |
| In[9]:= |
| Out[9]= | 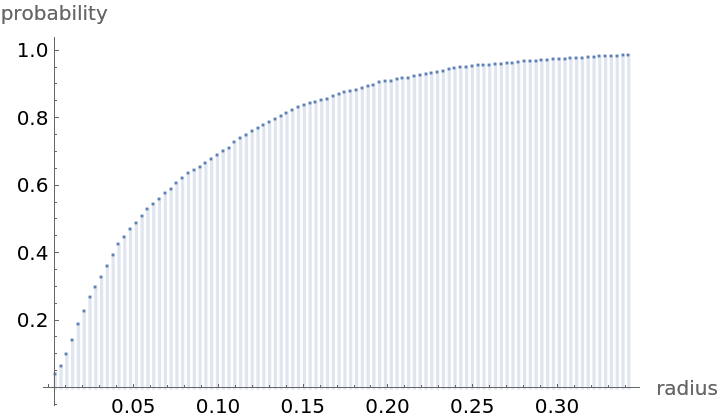 |
Mean distance between a typical point and its nearest neighbor (for positive support distribution can be approximated via a Riemann sum of 1-CDF):
| In[10]:= | ![step = maxR/100;
partition = Table[{k, k + step}, {k, 0, maxR, step}];
values = nnG[Mean /@ partition];](https://www.wolframcloud.com/obj/resourcesystem/images/03b/03bb5e97-34ae-4662-a591-07f29f067ffc/196c586794810ad8.png) |
| In[11]:= |
| Out[11]= |
Test for complete spacial randomness:
| In[12]:= | ![SpatialRandomnessTest[ResourceData[\!\(\*
TagBox["\"\<Sample Data: Shapley Supercluster Galaxies\>\"",
#& ,
BoxID -> "ResourceTag-Sample Data: Shapley Supercluster Galaxies-Input",
AutoDelete->True]\), "Data"], {"PValue", "TestConclusion"}]](https://www.wolframcloud.com/obj/resourcesystem/images/03b/03bb5e97-34ae-4662-a591-07f29f067ffc/5e55c37a822c1a81.png) |
| Out[12]= |
Gosia Konwerska, "Sample Data: Shapley Supercluster Galaxies" from the Wolfram Data Repository (2021)