Sample Data: Tennis Serves

Source Notebook

Locations of successful tennis serves annotated with serving player marks

Details

Locations of successful tennis serves in the observation region Rectangle[{-6.4, -4.115}, {6.4, 4.115}] meters, which is the union of all four service boxes of the tennis court where the origin is at the center of the rectangle, annotated with serving player marks.

Examples

Basic Examples (1) 

In[1]:=
ResourceData[\!\(\*
TagBox["\"\<Sample Data: Tennis Serves\>\"",
#& ,
BoxID -> "ResourceTag-Sample Data: Tennis Serves-Input",
AutoDelete->True]\), "Data"]
Out[1]=

Summary of the spatial point data:

In[2]:=
ResourceData[\!\(\*
TagBox["\"\<Sample Data: Tennis Serves\>\"",
#& ,
BoxID -> "ResourceTag-Sample Data: Tennis Serves-Input",
AutoDelete->True]\), "Data"]["Summary"]
Out[2]=

Visualizations (2) 

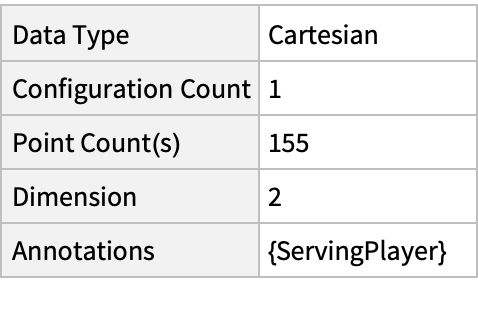
Plot the spatial point data:

In[3]:=
ListPlot[ResourceData[\!\(\*
TagBox["\"\<Sample Data: Tennis Serves\>\"",
#& ,
BoxID -> "ResourceTag-Sample Data: Tennis Serves-Input",
AutoDelete->True]\), "Data"], Frame -> True, AspectRatio -> 2/3]
Out[3]=

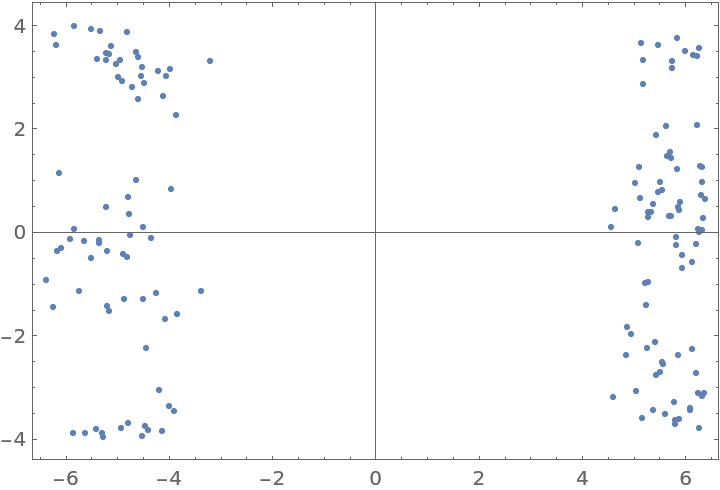
Visualize the data points with annotations:

In[4]:=
PointValuePlot[ResourceData[\!\(\*
TagBox["\"\<Sample Data: Tennis Serves\>\"",
#& ,
BoxID -> "ResourceTag-Sample Data: Tennis Serves-Input",
AutoDelete->True]\), "Data"], GridLines -> {{0}, {0}}, PlotLegends -> Automatic, AspectRatio -> 2/3]
Out[4]=

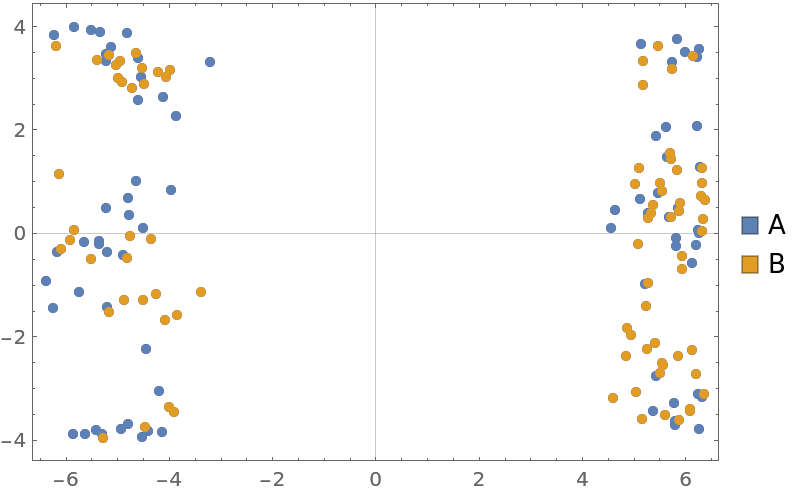
Gosia Konwerska, "Sample Data: Tennis Serves" from the Wolfram Data Repository (2022)  

Data Resource History

Source Metadata

Publisher Information