Wolfram Data Repository
Immediate Computable Access to Curated Contributed Data
Time to AIDS in years for adults and children
Originator: Klein and Moeschberger
(3 columns, 295 rows)
Retrieve the ResourceObject:
| In[1]:= |
| Out[1]= |  |
View the data:
| In[2]:= |
| Out[2]= | 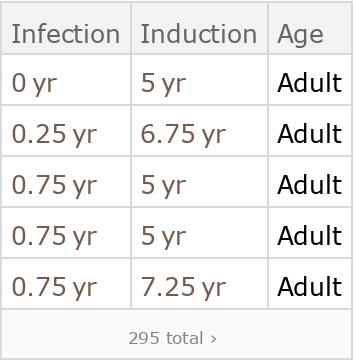 |
Generate a plot of the time of infection by the time of induction in years old:
| In[3]:= |
| Out[3]= | 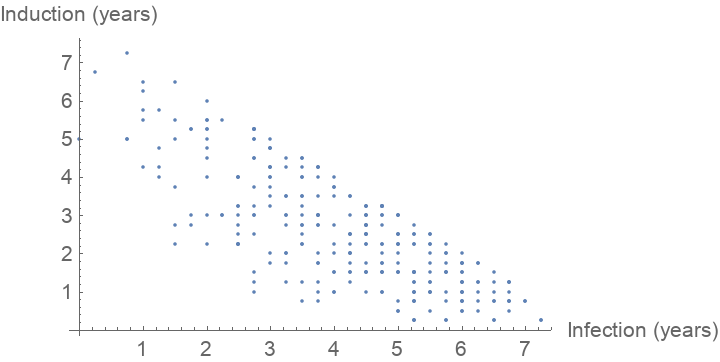 |
Wolfram Research, "Sample Data: Time to AIDS Induction" from the Wolfram Data Repository (2016) https://doi.org/10.24097/wolfram.44515.data