Sample Tabular Data: Car Models

Source Notebook

A dataset for cars manufactured between 1970–82 in the US, Europe and Japan and their associated prices and features

Details

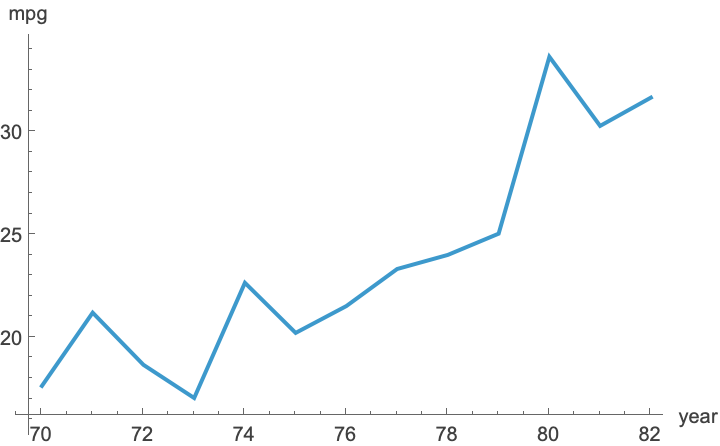
The period between 1970 and 1982 marked a significant shift in the United States car industry. American production shifted from heavy, powerful six and eight-cylinder cars with poor gas mileage to lighter, less powerful, four-cylinder cars with higher fuel efficiency. The global auto industry, including Americans and their European and Japanese competitors, raised overall miles per gallon (MPG) by focusing on four-cylinder cars and making them more fuel-efficient.
This dataset was taken from the StatLib library which is maintained at Carnegie Mellon University. The dataset was used in the 1983 American Statistical Association Exposition.

Examples

Basic Examples (2) 

In[1]:=
ResourceData[\!\(\*
TagBox["\"\<Sample Tabular Data: Car Models\>\"",
#& ,
BoxID -> "ResourceTag-Sample Tabular Data: Car Models-Input",
AutoDelete->True]\)]
Out[1]=
In[2]:=
Dimensions[ResourceData[\!\(\*
TagBox["\"\<Sample Tabular Data: Car Models\>\"",
#& ,
BoxID -> "ResourceTag-Sample Tabular Data: Car Models-Input",
AutoDelete->True]\)]]
Out[2]=

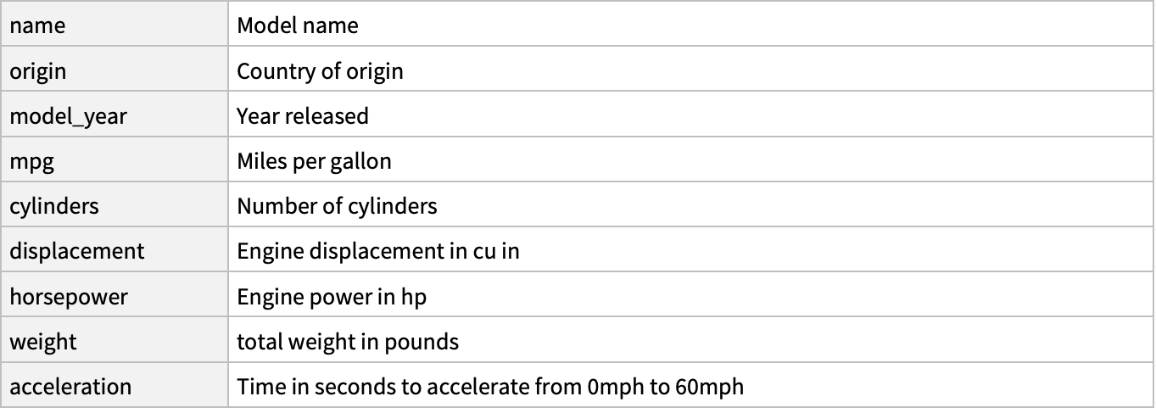
Column keys and descriptions:

In[3]:=
ResourceData[\!\(\*
TagBox["\"\<Sample Tabular Data: Car Models\>\"",
#& ,
BoxID -> "ResourceTag-Sample Tabular Data: Car Models-Input",
AutoDelete->True]\), "ColumnKeys"]
Out[3]=
In[4]:=
ResourceData[\!\(\*
TagBox["\"\<Sample Tabular Data: Car Models\>\"",
#& ,
BoxID -> "ResourceTag-Sample Tabular Data: Car Models-Input",
AutoDelete->True]\), "ColumnDescriptions"] // Dataset
Out[4]=

Column types:

In[5]:=
ResourceData[\!\(\*
TagBox["\"\<Sample Tabular Data: Car Models\>\"",
#& ,
BoxID -> "ResourceTag-Sample Tabular Data: Car Models-Input",
AutoDelete->True]\), "ColumnTypes"]
Out[5]=

Scope & Additional Elements (2) 

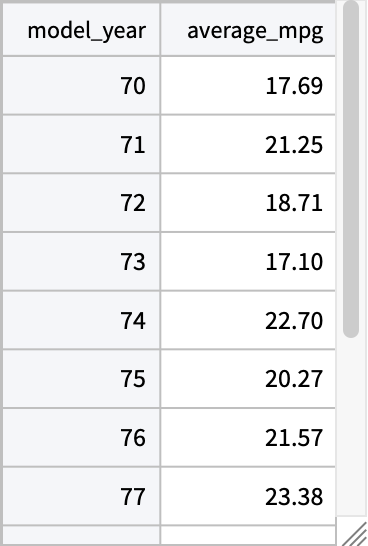
Average mileage across all models for each year:

In[6]:=
avg = AggregateRows[ResourceData[\!\(\*
TagBox["\"\<Sample Tabular Data: Car Models\>\"",
#& ,
BoxID -> "ResourceTag-Sample Tabular Data: Car Models-Input",
AutoDelete->True]\)], "average_mpg" -> Function[Mean[#mpg]], "model_year"]
Out[6]=
In[7]:=
ListLinePlot[avg -> {"model_year", "average_mpg"}, AxesLabel -> {"year", "mpg"}]
Out[7]=

Tally per year and per country of origin:

In[8]:=
PivotTable[ResourceData[\!\(\*
TagBox["\"\<Sample Tabular Data: Car Models\>\"",
#& ,
BoxID -> "ResourceTag-Sample Tabular Data: Car Models-Input",
AutoDelete->True]\)], Function[Length[#"model_year"]], "origin", "model_year"]
Out[8]=

Gosia Konwerska, "Sample Tabular Data: Car Models" from the Wolfram Data Repository (2024)  

Data Resource History

Source Metadata

See Also

Data Downloads

Publisher Information