Wolfram Data Repository
Immediate Computable Access to Curated Contributed Data
Life expectancy vs. health expenditure, 1970 to 2020, for selected countries
| In[1]:= |
| Out[1]= | 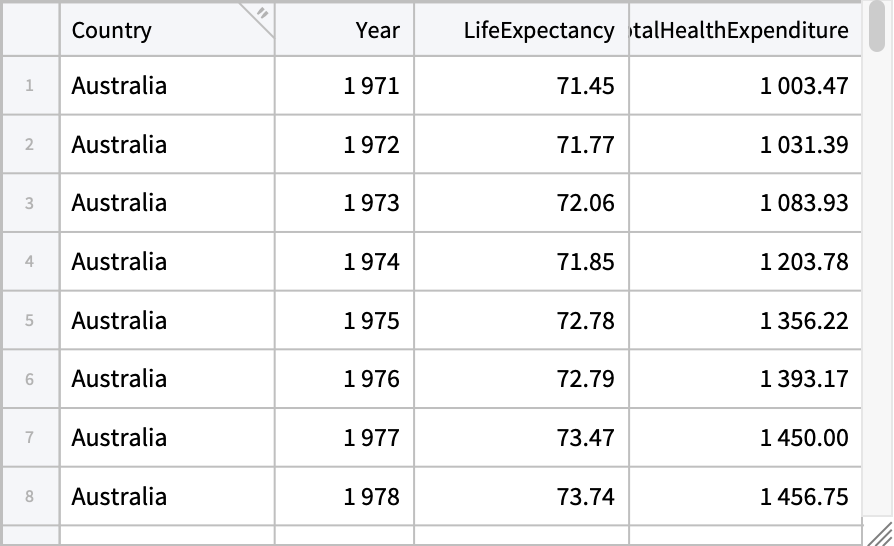 |
Data dimensions:
| In[2]:= |
| Out[2]= |
Column keys and types:
| In[3]:= |
| Out[3]= |
| In[4]:= |
| Out[4]= |
All the countries in the data:
| In[5]:= |
| Out[5]= |
Convert "Country" and "Year" columns to "KeyColumns" to gain easy access to specific values:
| In[6]:= | ![newdata = Tabular[ResourceData[\!\(\*
TagBox["\"\<Sample Tabular Data: Health Expenditure\>\"",
#& ,
BoxID -> "ResourceTag-Sample Tabular Data: Health Expenditure-Input",
AutoDelete->True]\)], "KeyColumns" -> {"Country", "Year"}]](https://www.wolframcloud.com/obj/resourcesystem/images/448/44828a32-3499-4651-b26d-3cac984d82a4/15c38738ff596280.png) |
| Out[6]= | 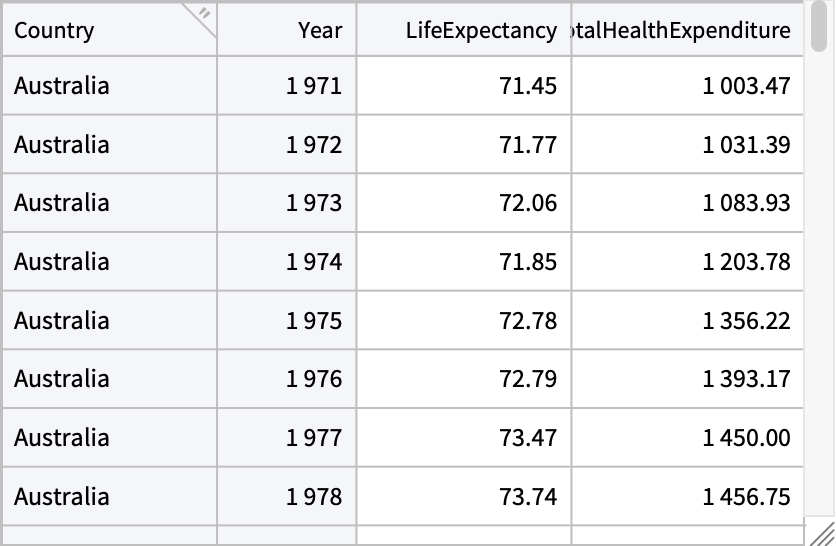 |
Now use RowKey to extract data for New Zealand in 2021:
| In[7]:= |
| Out[7]= |
| In[8]:= |
| Out[8]= |
Or get a single value directly:
| In[9]:= |
| Out[9]= |
Countries with highest life expectancy in 2019 and in 2022:
| In[10]:= | ![subtab2019 = Select[ResourceData[\!\(\*
TagBox["\"\<Sample Tabular Data: Health Expenditure\>\"",
#& ,
BoxID -> "ResourceTag-Sample Tabular Data: Health Expenditure-Input",
AutoDelete->True]\)], Function[MatchQ[#Year, 2019]]];
subtab2022 = Select[ResourceData[\!\(\*
TagBox["\"\<Sample Tabular Data: Health Expenditure\>\"",
#& ,
BoxID -> "ResourceTag-Sample Tabular Data: Health Expenditure-Input",
AutoDelete->True]\)], Function[MatchQ[#Year, 2022]]];](https://www.wolframcloud.com/obj/resourcesystem/images/448/44828a32-3499-4651-b26d-3cac984d82a4/227b42e53ddffe7c.png) |
Take 8 countries with largest life expectancy:
| In[11]:= |
| In[12]:= |
| Out[12]= | 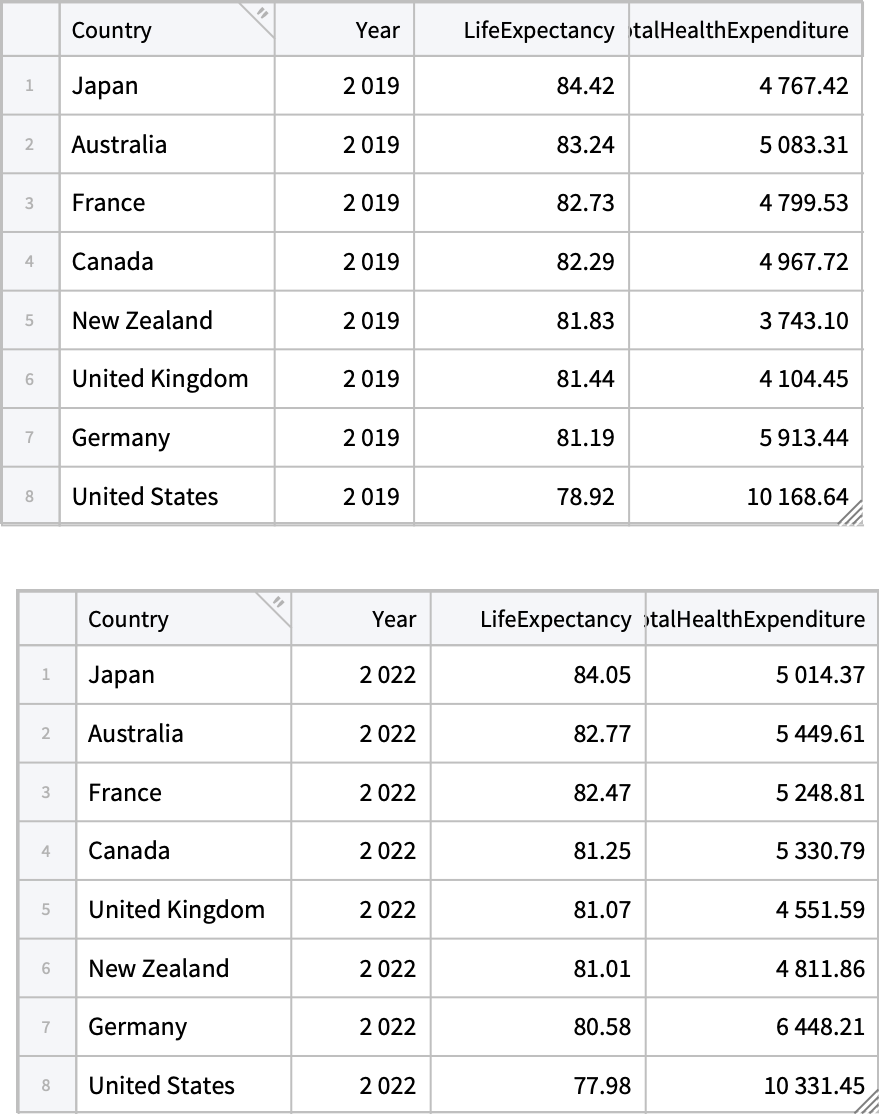 |
Visualize the 2022 life expectancy on a map:
| In[13]:= |
| Out[13]= |
| In[14]:= |
| In[15]:= | ![Legended[
GeoRegionValuePlot[
entities2022 -> Normal[max2022[All, "LifeExpectancy"]], ColorFunction -> cf, PlotLabel -> 2022, PlotLegends -> None, ImageSize -> 500], legend]](https://www.wolframcloud.com/obj/resourcesystem/images/448/44828a32-3499-4651-b26d-3cac984d82a4/2053a55c5440bae0.png) |
| Out[15]= | 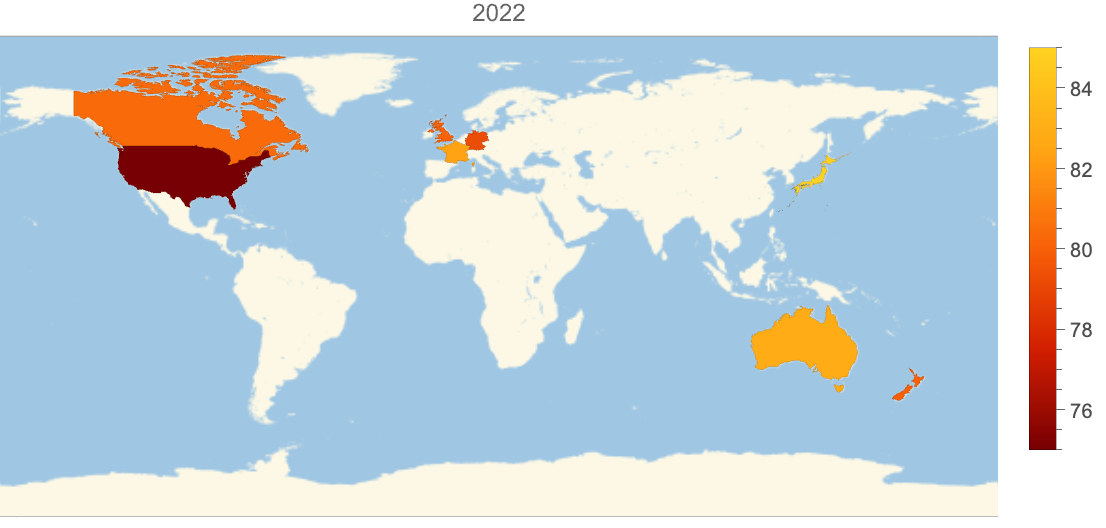 |
Life expectancy and health expenditure for the United States:
| In[16]:= | ![tabUSA = Select[ResourceData[\!\(\*
TagBox["\"\<Sample Tabular Data: Health Expenditure\>\"",
#& ,
BoxID -> "ResourceTag-Sample Tabular Data: Health Expenditure-Input",
AutoDelete->True]\)], Function[MatchQ[#Country, "United States"]]]](https://www.wolframcloud.com/obj/resourcesystem/images/448/44828a32-3499-4651-b26d-3cac984d82a4/41dc068e6ed2f58f.png) |
| Out[16]= | 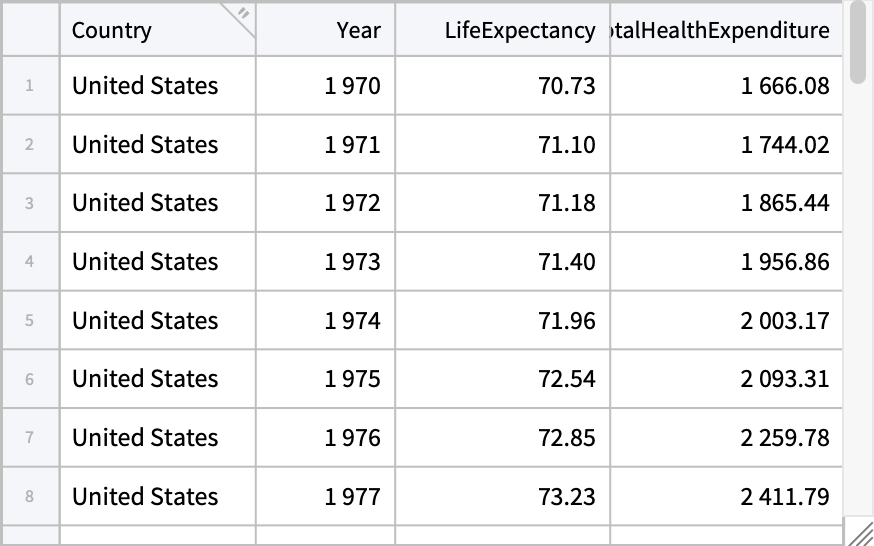 |
Year span:
| In[17]:= |
| Out[17]= |
The covid19 pandemic had effected the life expectancy:
| In[18]:= | ![ListPlot[(tabUSA -> {"Year", "LifeExpectancy"}), PlotHighlighting -> Placed["Dropline", 2021], AxesLabel -> {"year", "age"}]](https://www.wolframcloud.com/obj/resourcesystem/images/448/44828a32-3499-4651-b26d-3cac984d82a4/71eea0107b4453d1.png) |
| Out[18]= |  |
The total health expenditure was higher than the predicted trend due to the covid19 pandemic:
| In[19]:= |
| Out[19]= |
| In[20]:= |
| Out[20]= | 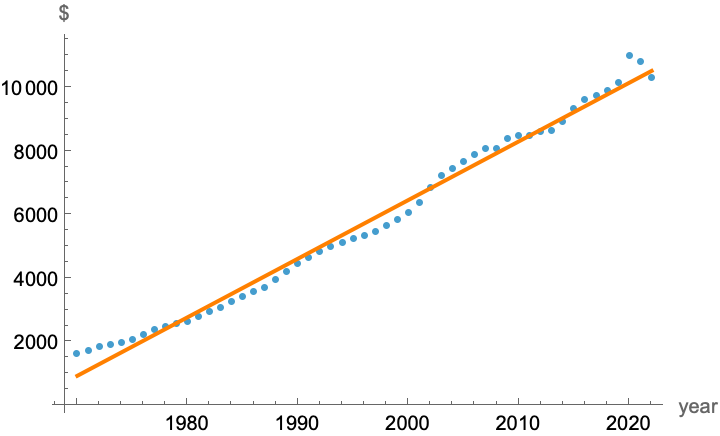 |
Gosia Konwerska, "Sample Tabular Data: Health Expenditure" from the Wolfram Data Repository (2024)