Wolfram Data Repository
Immediate Computable Access to Curated Contributed Data
2015 Street Tree Census in New York City
| In[1]:= |
| Out[1]= | 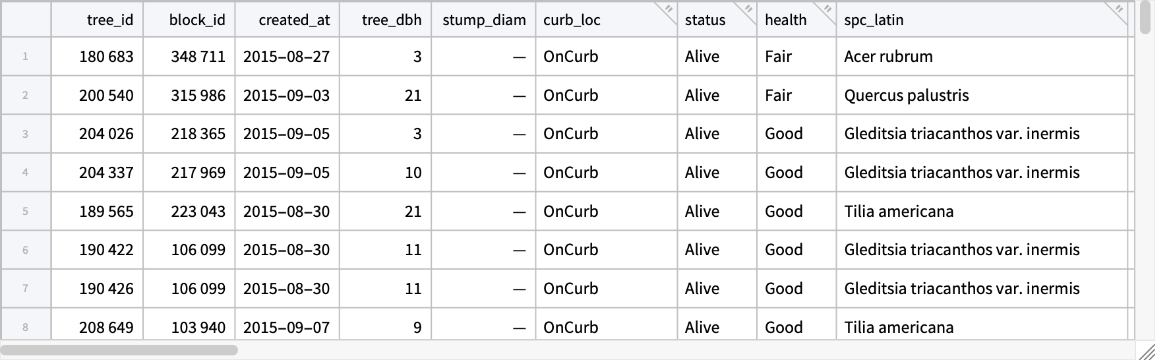 |
Column keys and types:
| In[2]:= |
| Out[2]= |  |
| In[3]:= |
| Out[3]= |  |
Full tabular structure:
| In[4]:= |
| Out[4]= | 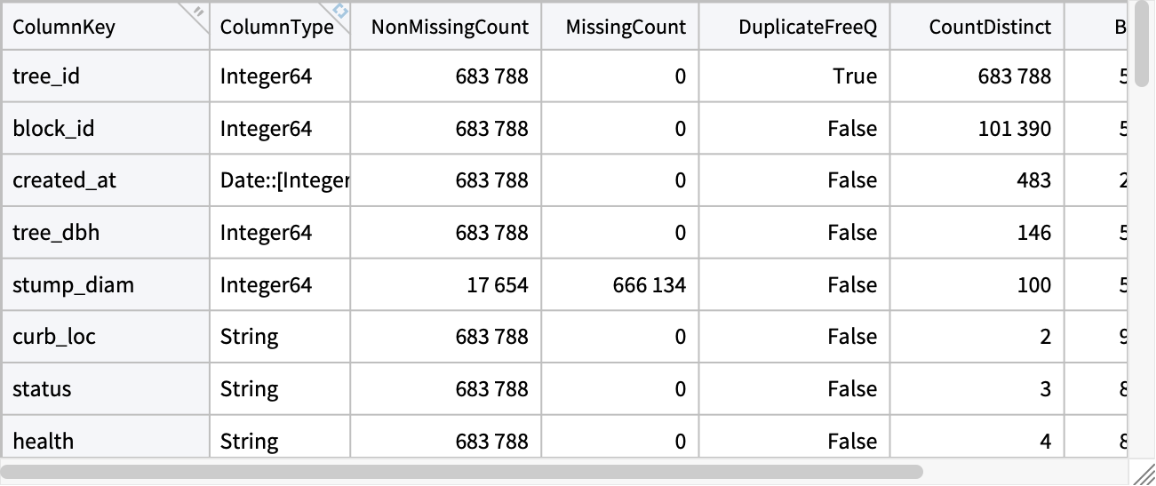 |
Column descriptions:
| In[5]:= |
| Out[5]= | 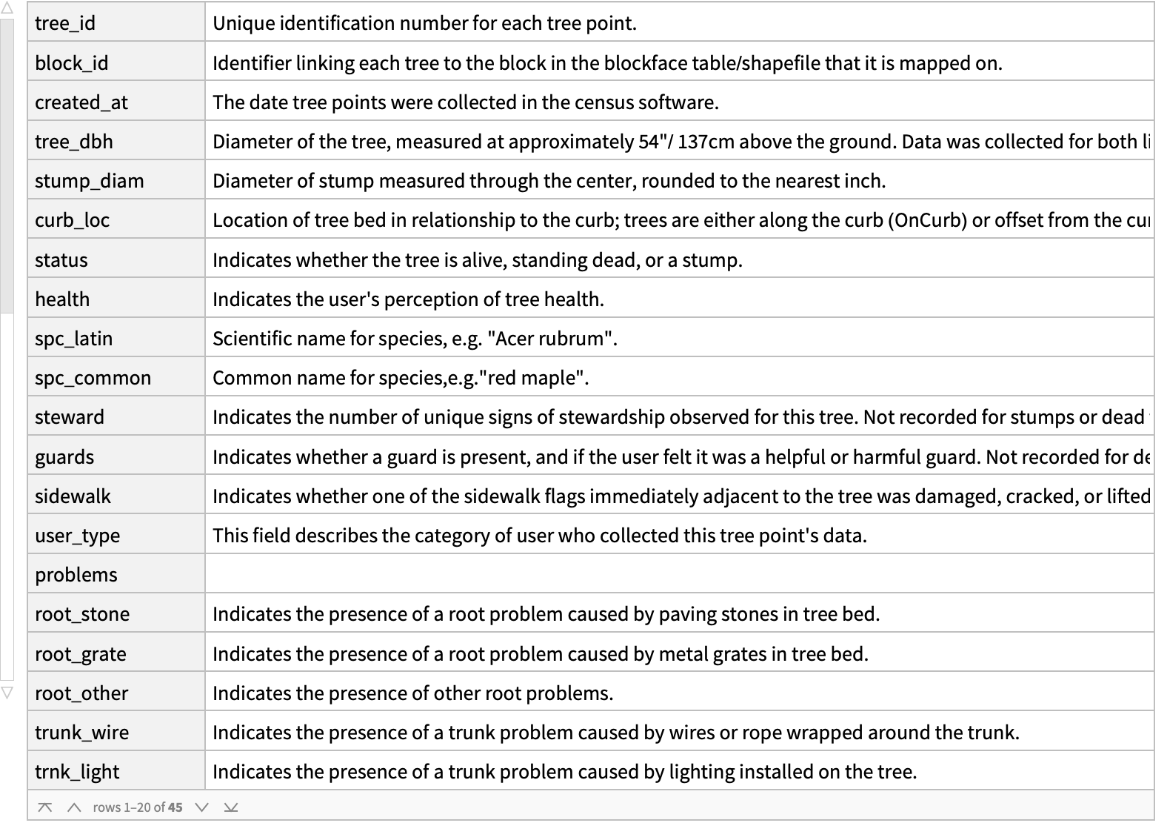 |
Plot the histogram of the tree diameter at breast height:
| In[6]:= |
| Out[6]= | 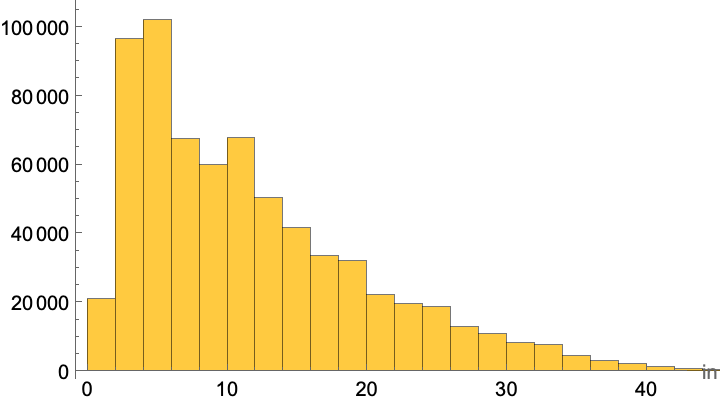 |
Compute mean diameter at breast height for each tree species and reverse sort by the mean:
| In[7]:= | ![meandbh = ReverseSortBy[AggregateRows[ResourceData[\!\(\*
TagBox["\"\<Sample Tabular Data: NYC Trees\>\"",
#& ,
BoxID -> "ResourceTag-Sample Tabular Data: NYC Trees-Input",
AutoDelete->True]\)], "meandbh" -> Function[Mean[#"tree_dbh"]], "spc_common"], "meandbh"]](https://www.wolframcloud.com/obj/resourcesystem/images/d6e/d6ed0e10-af11-425c-a28c-b2dd6b9366f3/611a577e70634048.png) |
| Out[7]= | 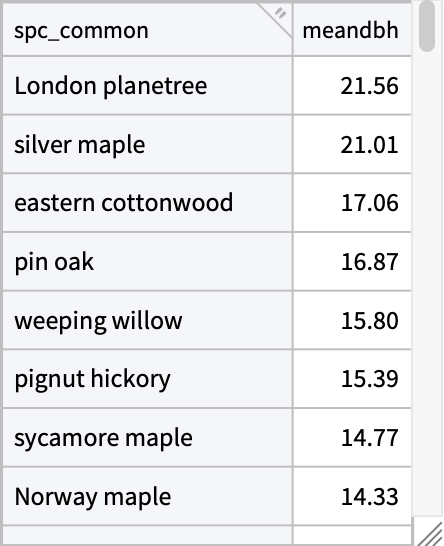 |
Compute the ratio of each mean to the mean of all the trees:
| In[8]:= |
| Out[8]= | 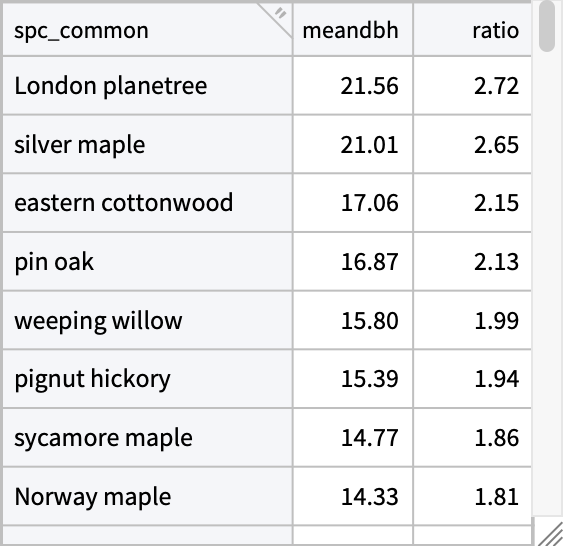 |
Select the health and species columns, discard all rows with any number of missing (empty strings), and sort by name:
| In[9]:= | ![health = SortBy[Discard[ResourceData[\!\(\*
TagBox["\"\<Sample Tabular Data: NYC Trees\>\"",
#& ,
BoxID -> "ResourceTag-Sample Tabular Data: NYC Trees-Input",
AutoDelete->True]\)][All, {"spc_common", "health"}], Count[#, ""] > 0 &], "spc_common"]](https://www.wolframcloud.com/obj/resourcesystem/images/d6e/d6ed0e10-af11-425c-a28c-b2dd6b9366f3/14838f3b9c6bd101.png) |
| Out[9]= | 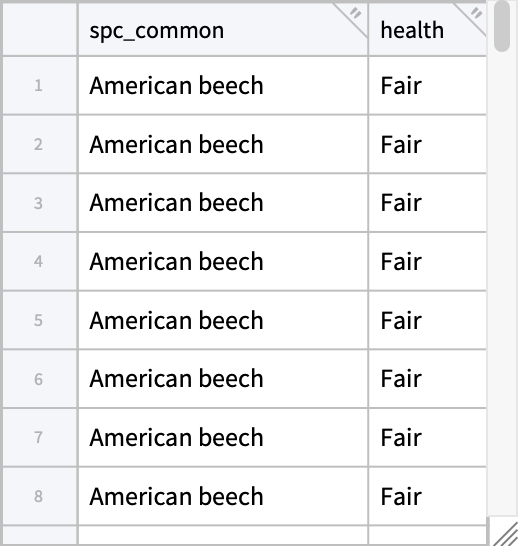 |
Tally the health conditions for each species:
| In[10]:= |
| Out[10]= | 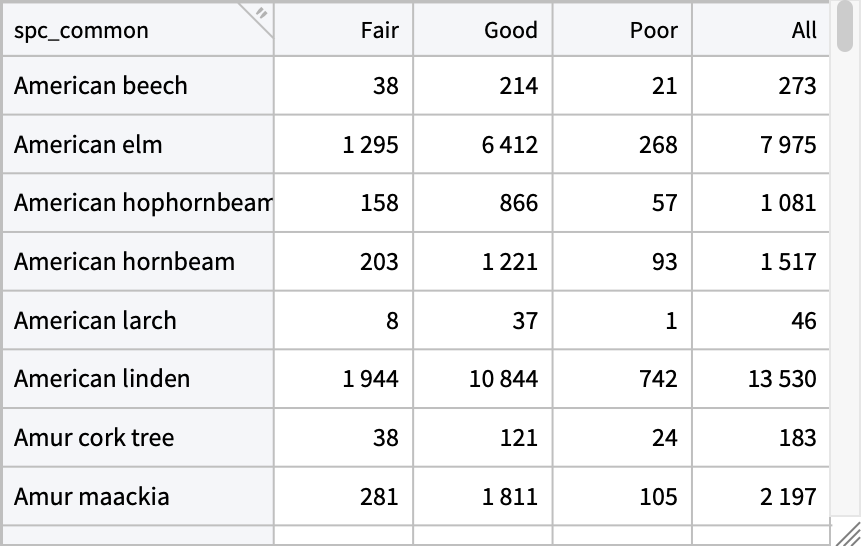 |
Visualize the health conditions:
| In[11]:= |
| Out[11]= | 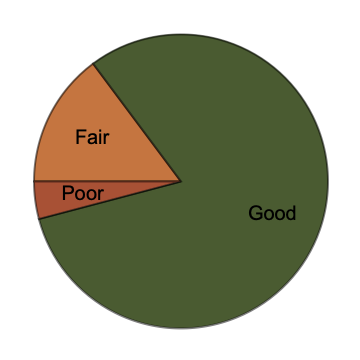 |
Visualize the tree species counts:
| In[12]:= | ![counts = AggregateRows[ResourceData[\!\(\*
TagBox["\"\<Sample Tabular Data: NYC Trees\>\"",
#& ,
BoxID -> "ResourceTag-Sample Tabular Data: NYC Trees-Input",
AutoDelete->True]\)], "count" -> Function[Length[#"spc_common"]], "spc_common"]](https://www.wolframcloud.com/obj/resourcesystem/images/d6e/d6ed0e10-af11-425c-a28c-b2dd6b9366f3/452e078160d50fce.png) |
| Out[12]= | 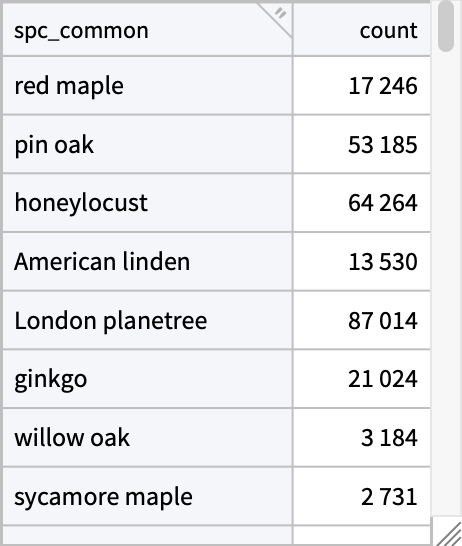 |
Remove the missing and sort by count:
| In[13]:= |
| Out[13]= | 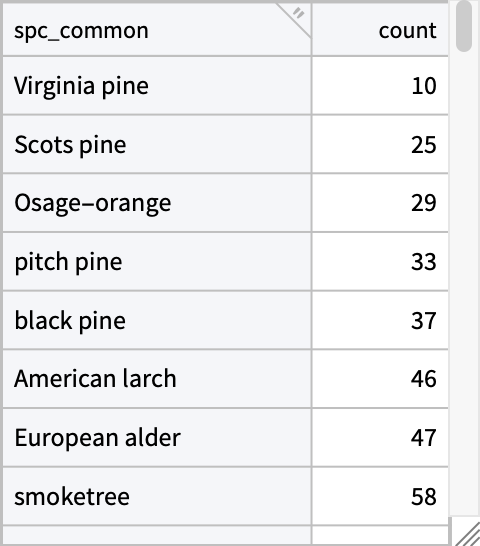 |
| In[14]:= |
| In[15]:= |
| Out[15]= | 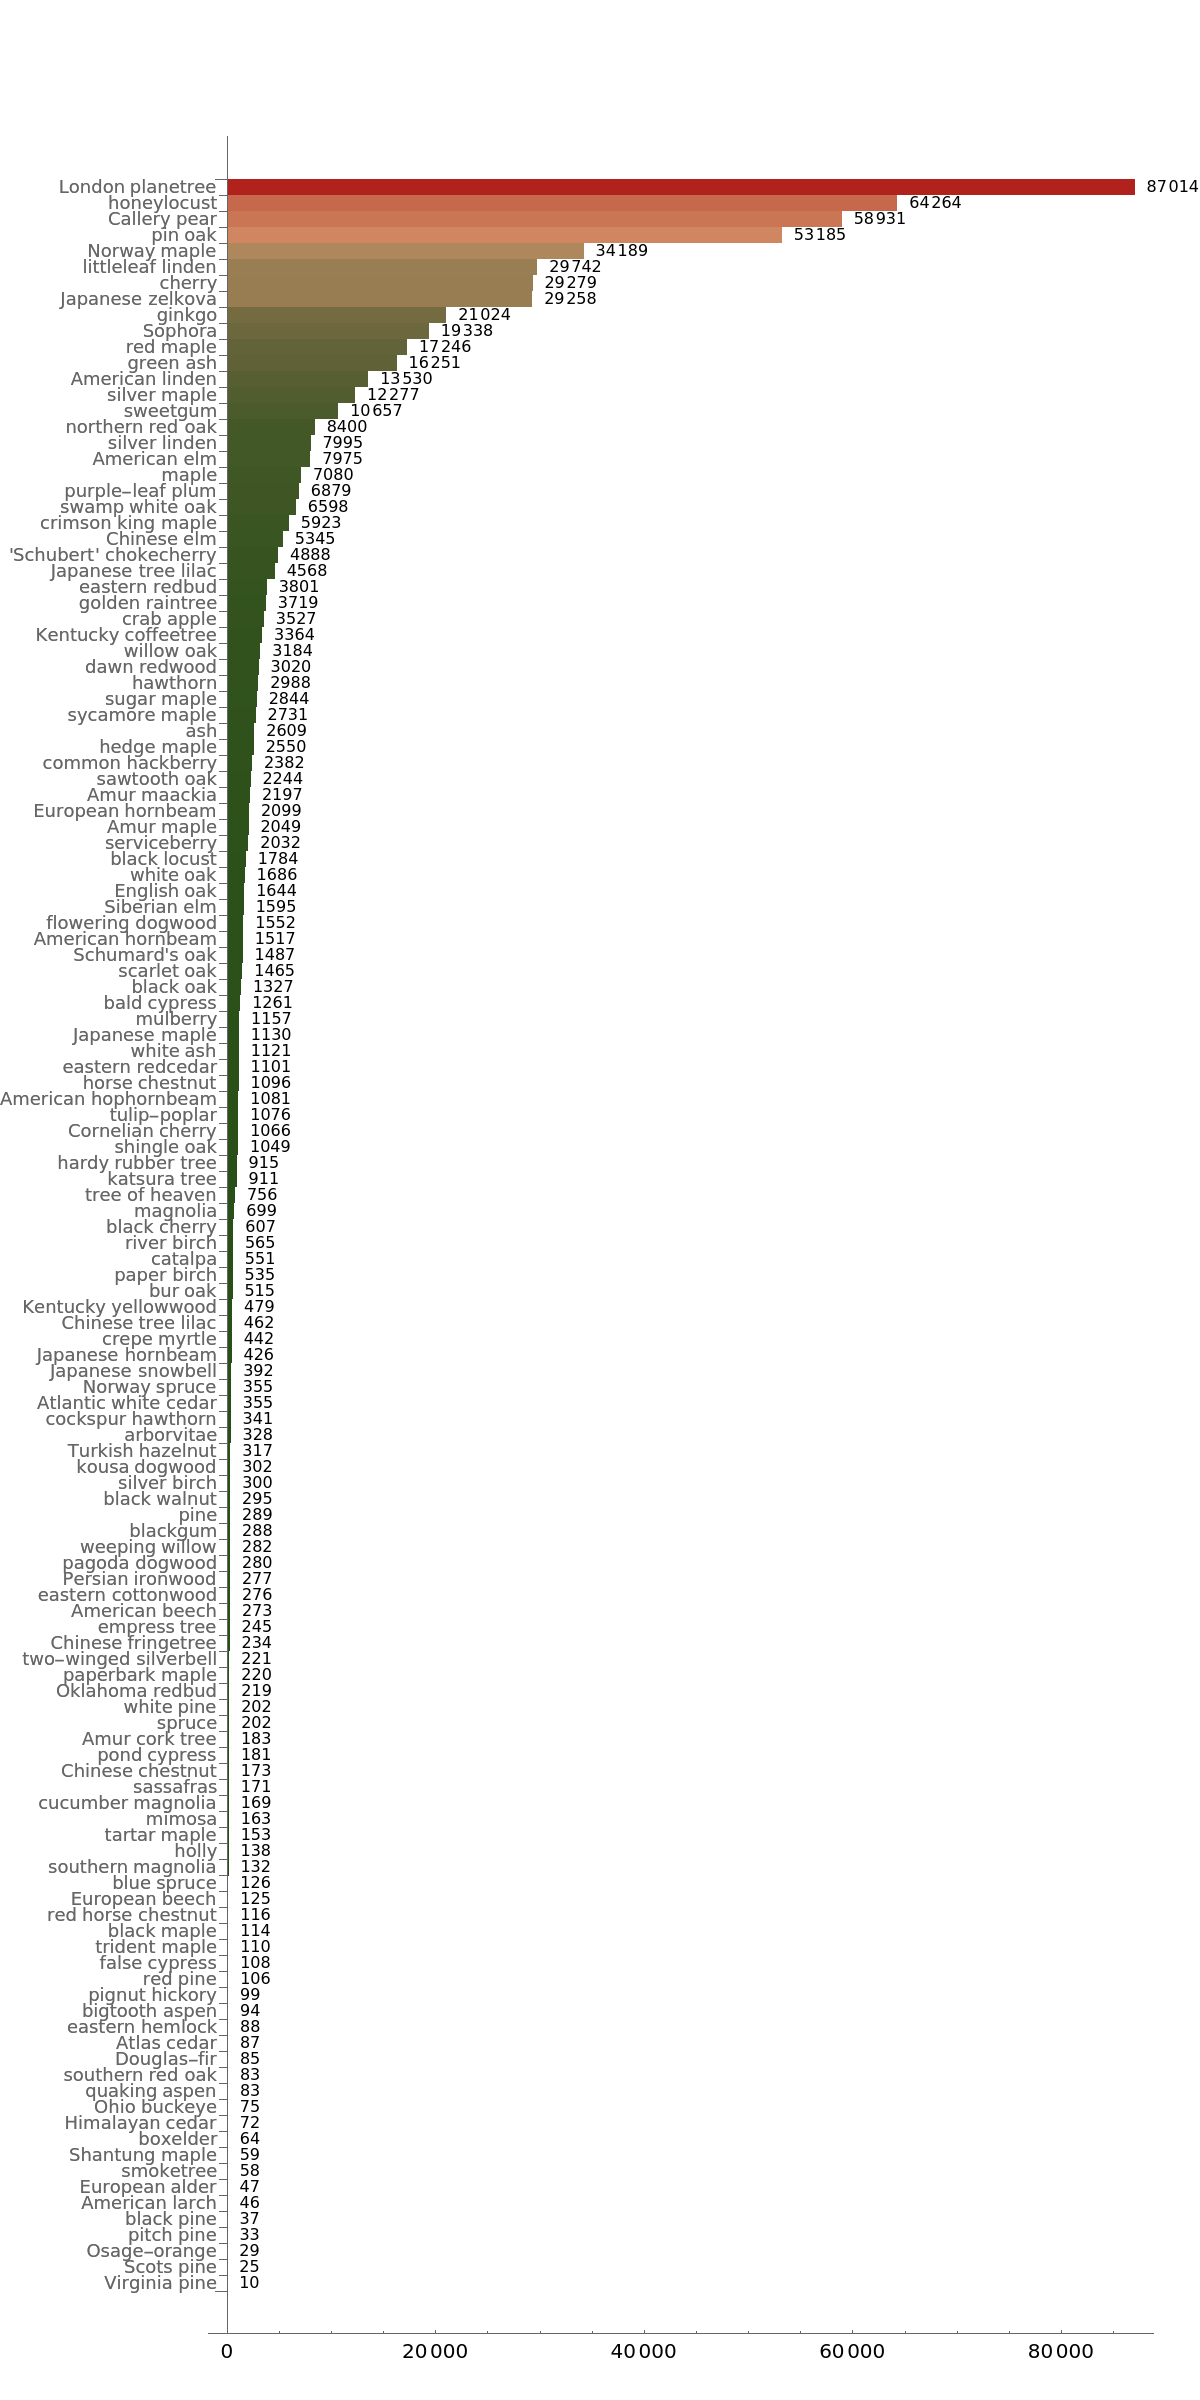 |
Take a subset of columns including location information and remove rows with missing values:
| In[16]:= | ![tab = Discard[ResourceData[\!\(\*
TagBox["\"\<Sample Tabular Data: NYC Trees\>\"",
#& ,
BoxID -> "ResourceTag-Sample Tabular Data: NYC Trees-Input",
AutoDelete->True]\)][
All, {"tree_id", "spc_latin", "spc_common", "borough", "latitude", "longitude"}], Count[#, ""] > 0 &]](https://www.wolframcloud.com/obj/resourcesystem/images/d6e/d6ed0e10-af11-425c-a28c-b2dd6b9366f3/658f70617478f99b.png) |
| Out[16]= | 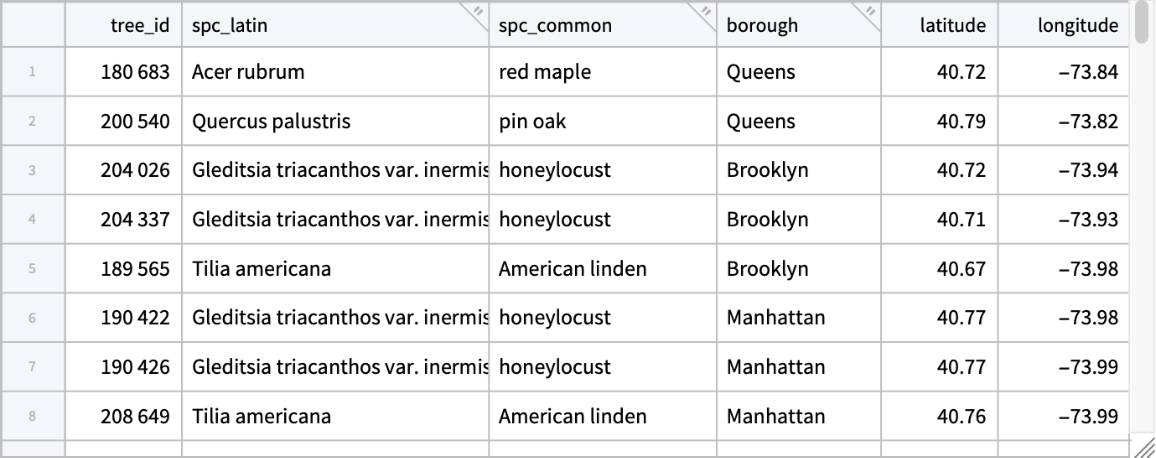 |
Select all the magnolias:
| In[17]:= |
| Out[17]= | 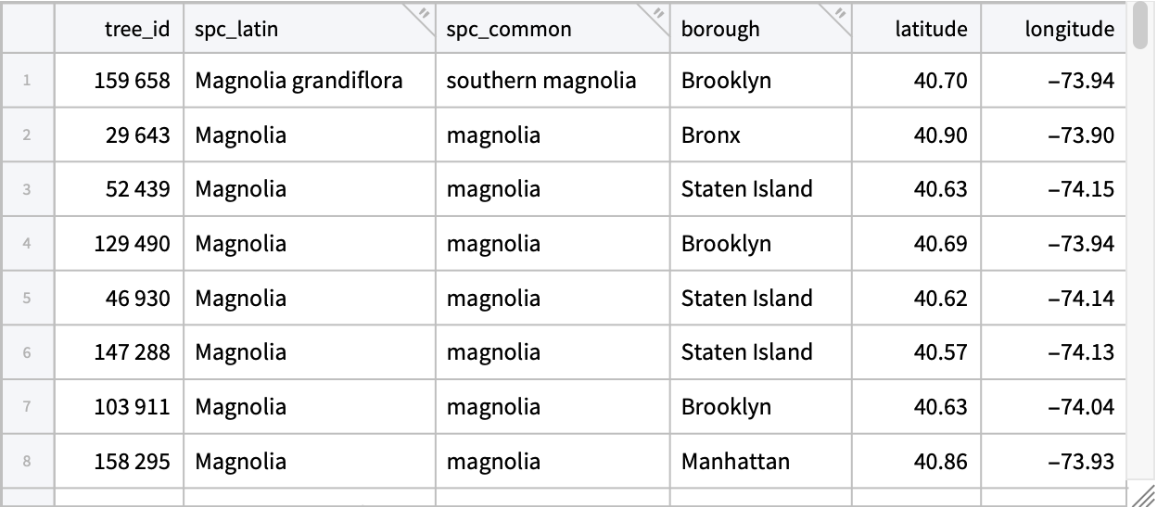 |
Count the number of each magnolia species in each borough:
| In[18]:= |
| Out[18]= | 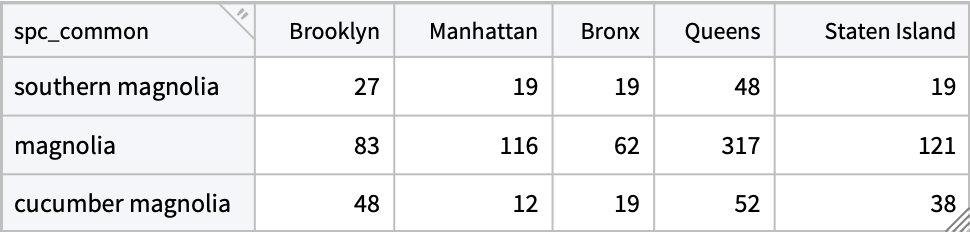 |
Include summary counts:
| In[19]:= |
| Out[19]= | 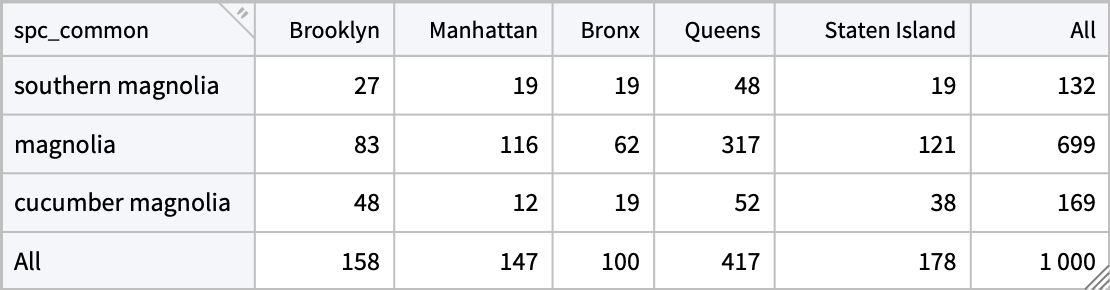 |
Visualize the magnolia tree locations:
| In[20]:= |
| Out[20]= | 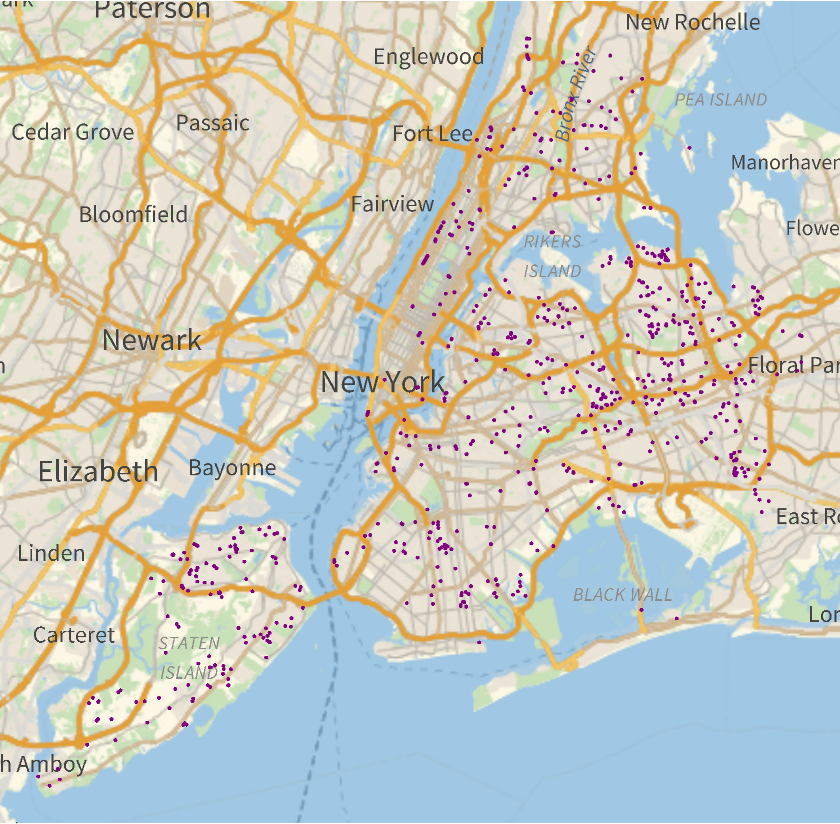 |
Gosia Konwerska, "Sample Tabular Data: NYC Trees" from the Wolfram Data Repository (2024)