Wolfram Data Repository
Immediate Computable Access to Curated Contributed Data
Sales data including customer and transaction information
| In[1]:= |
| Out[1]= | 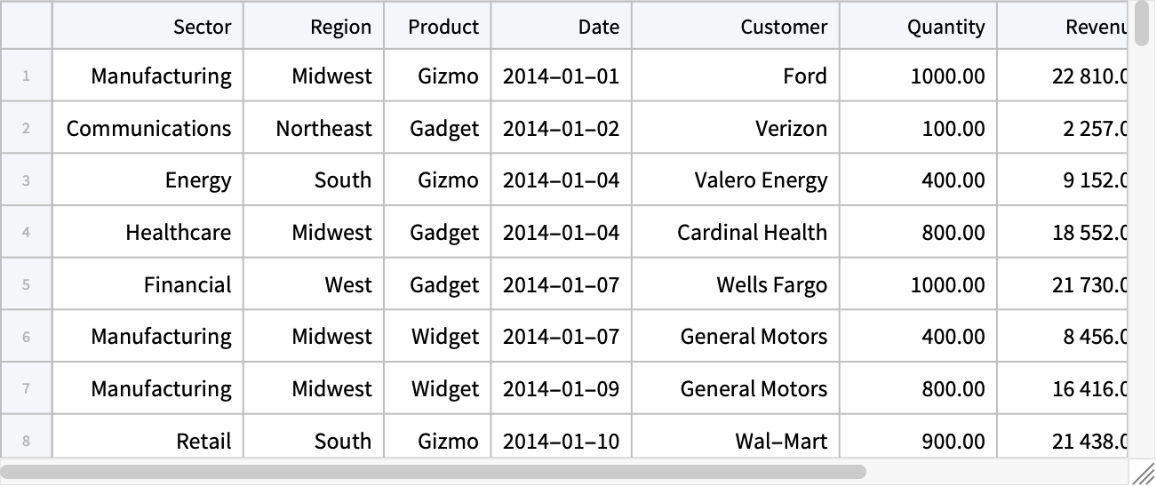 |
Dimensions:
| In[2]:= |
| Out[2]= |
Column keys and types:
| In[3]:= |
| Out[3]= |
| In[4]:= |
| Out[4]= | 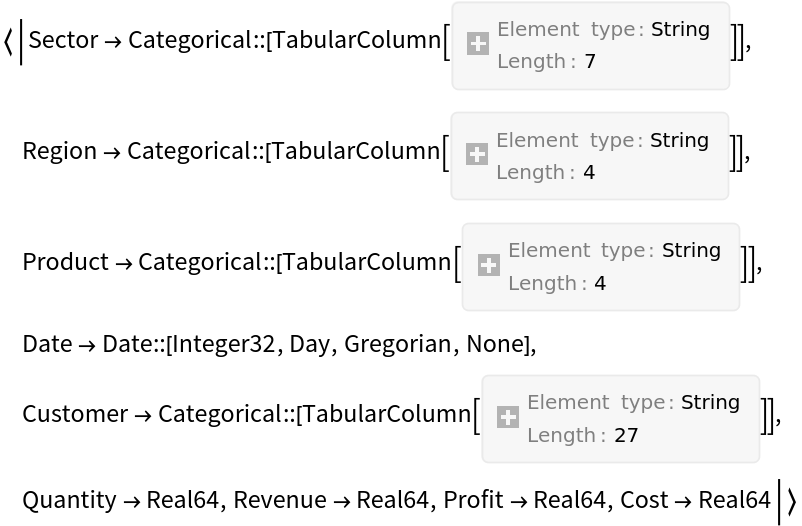 |
Reorder columns to display customer information together:
| In[5]:= |
| Out[5]= | 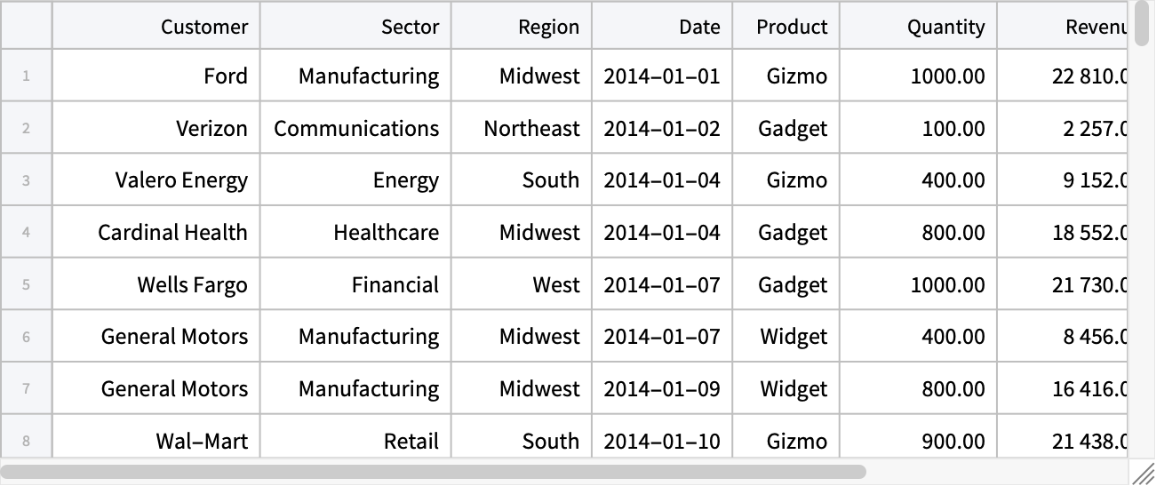 |
Total revenue for each customer in alphabetical order:
| In[6]:= | ![SortBy[AggregateRows[ResourceData[\!\(\*
TagBox["\"\<Sample Tabular Data: Sales Data\>\"",
#& ,
BoxID -> "ResourceTag-Sample Tabular Data: Sales Data-Input",
AutoDelete->True]\)], "TotalRevenue" -> Function[Total[#Revenue]], "Customer"], "Customer"]](https://www.wolframcloud.com/obj/resourcesystem/images/c33/c3383393-e44c-4020-8e0e-4f98117363df/636f0d0cf3bd0b2c.png) |
| Out[6]= | 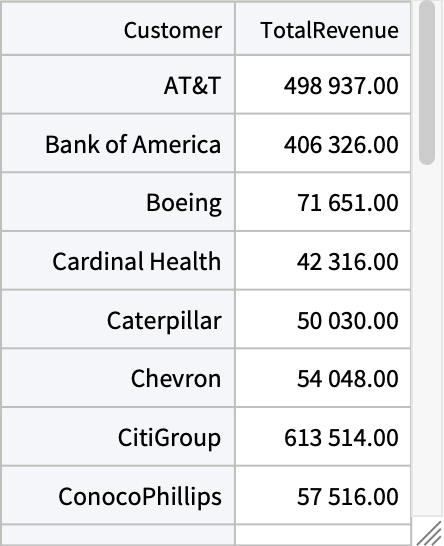 |
Total revenue for each sector ordered according to the total revenue:
| In[7]:= | ![revenue = ReverseSortBy[AggregateRows[ResourceData[\!\(\*
TagBox["\"\<Sample Tabular Data: Sales Data\>\"",
#& ,
BoxID -> "ResourceTag-Sample Tabular Data: Sales Data-Input",
AutoDelete->True]\)], "TotalRevenue" -> Function[Total[#Revenue]], "Sector"], "TotalRevenue"]](https://www.wolframcloud.com/obj/resourcesystem/images/c33/c3383393-e44c-4020-8e0e-4f98117363df/30fdd7dcb403b8ea.png) |
| Out[7]= | 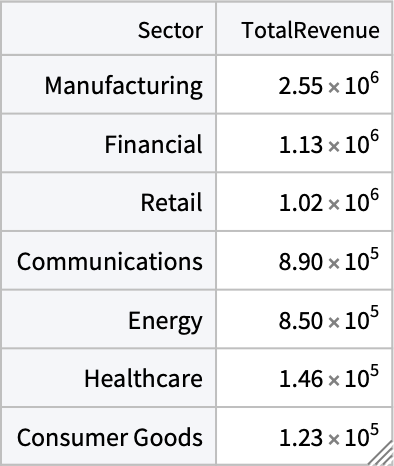 |
Visualize:
| In[8]:= |
| Out[8]= | 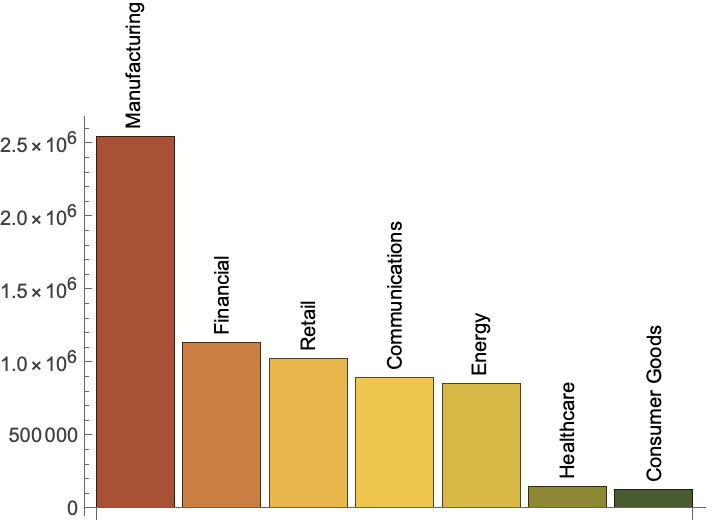 |
Total profit for each product in each region:
| In[9]:= | ![tab = PivotTable[ResourceData[\!\(\*
TagBox["\"\<Sample Tabular Data: Sales Data\>\"",
#& ,
BoxID -> "ResourceTag-Sample Tabular Data: Sales Data-Input",
AutoDelete->True]\)], Function[Total[#Profit]], "Product", "Region"]](https://www.wolframcloud.com/obj/resourcesystem/images/c33/c3383393-e44c-4020-8e0e-4f98117363df/60cb7fd9b52b282e.png) |
| Out[9]= | 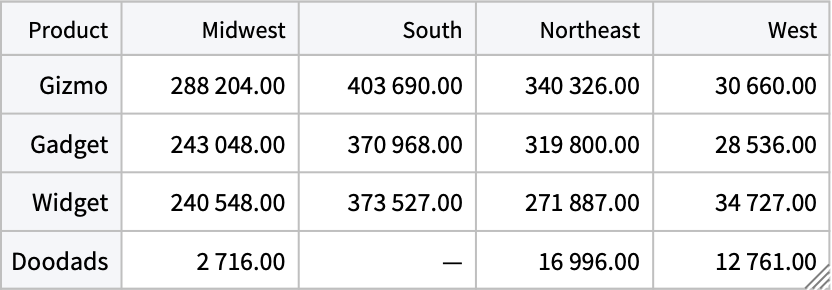 |
| In[10]:= |
| Out[10]= |
Extract the data for each product:
| In[11]:= |
| Out[11]= |
Visualize the profit of each product:
| In[12]:= |
| Out[12]= | 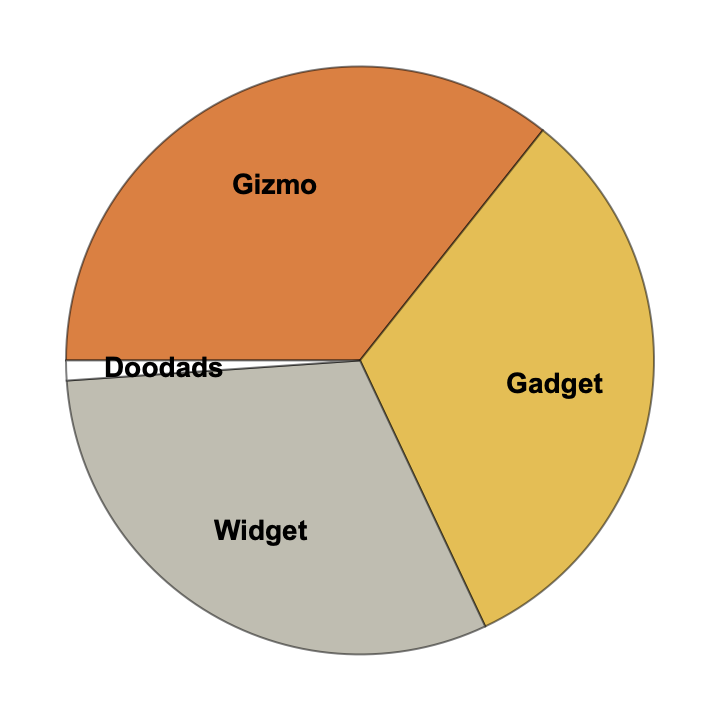 |
Visualize the profit of each product within each region:
| In[13]:= |
| Out[13]= |
| In[14]:= |
| In[15]:= | ![Clear[style]; aux = Flatten@Transpose@
Table[style[#, Directive[Opacity[.5], ColorData[42, k]]] & /@ data[[k]], {k, 1, 4}];](https://www.wolframcloud.com/obj/resourcesystem/images/c33/c3383393-e44c-4020-8e0e-4f98117363df/35af257f5eb4a8ee.png) |
| In[16]:= | ![PieChart[{Total /@ DeleteMissing[Transpose[data], 2], aux /. style -> Style}, SectorSpacing -> 0, ChartStyle -> (Directive[ColorData[97, #]] & /@ Range[4]), SectorOrigin -> {Automatic, .3}, LabelingFunction -> labeler, Epilog -> Text[Style["Profit", Bold, 11]], ImagePadding -> 0, ImageSize -> 400]](https://www.wolframcloud.com/obj/resourcesystem/images/c33/c3383393-e44c-4020-8e0e-4f98117363df/748a438b8efd73c8.png) |
| Out[16]= | 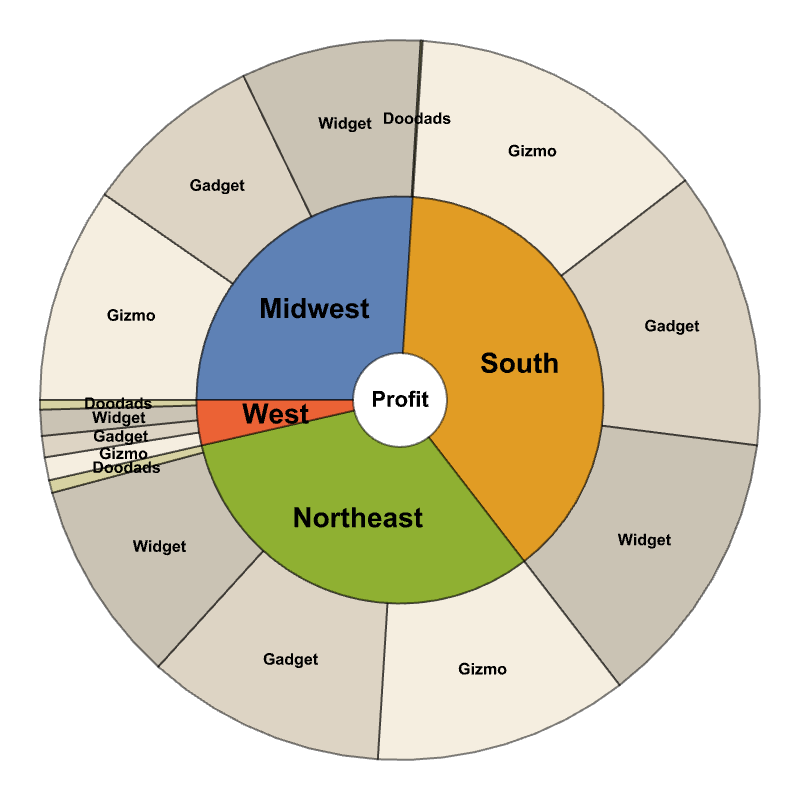 |
Gosia Konwerska, "Sample Tabular Data: Sales Data" from the Wolfram Data Repository (2025)