Details
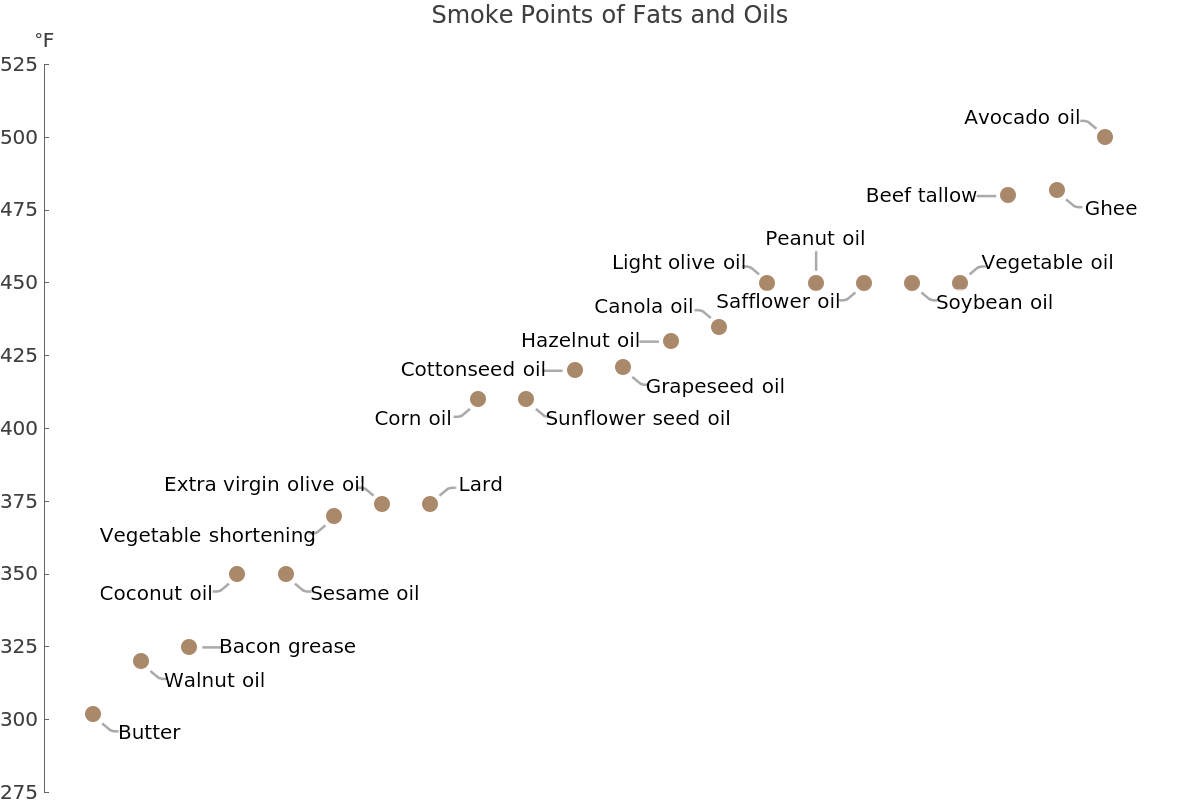
This data contains the smoke point values for 22 cooking fats and oils.
The smoke point of a solid fat or liquid oil is the temperature at which it begins to smoke and break down. The smoke point is determined by the amount of free fatty acids the fat or oil contains.
Plant-based oils generally have fewer free fatty acids than animal fats. Therefore, vegetable oils like canola and corn oil tend to be more stable and have a higher smoke point.
Smoke points are approximate and can vary within the same type of oil, depending upon whether the oil is refined or unrefined.
Unrefined oils, such as sesame oil or extra virgin olive oil, have a lower smoke point and can burn more quickly. Unrefined oils are best for dressings and low–medium heat cooking.
Refined oils have undergone processing to remove impurities and have fewer free fatty acids. They have a milder, more neutral taste and higher smoke points, generally 400°F or greater. Because they can tolerate high heat, refined oils are appropriate for searing and frying.

![sortedOilsData = SortBy[ResourceData[\!\(\*
TagBox["\"\<Smoke Point\>\"",
#& ,
BoxID -> "ResourceTag-Smoke Point-Input",
AutoDelete->True]\)], "Fahrenheit"];
ListPlot[sortedOilsData -> "Fahrenheit", Sequence[
Axes -> {False, True}, AxesLabel -> "°F", Ticks -> {None,
Range[275, 525, 25]}, PlotRange -> {275, 525}, PlotLabel -> "Smoke Points of Fats and Oils", PlotStyle -> StandardBrown, LabelingFunction -> (sortedOilsData[
Part[#2, 2], "Oil type"]& ), ImageSize -> 600]]](https://www.wolframcloud.com/obj/resourcesystem/images/2fa/2fa40c86-7630-460a-a7e5-94530213d1d9/0d990f3b03855bfb.png)
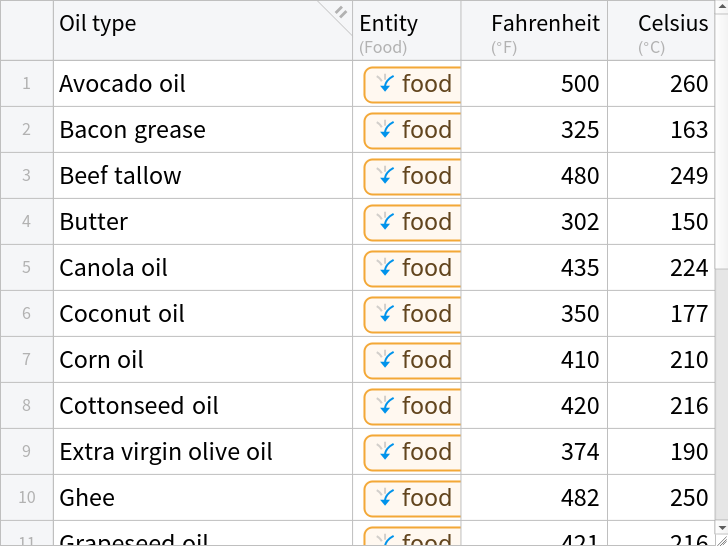
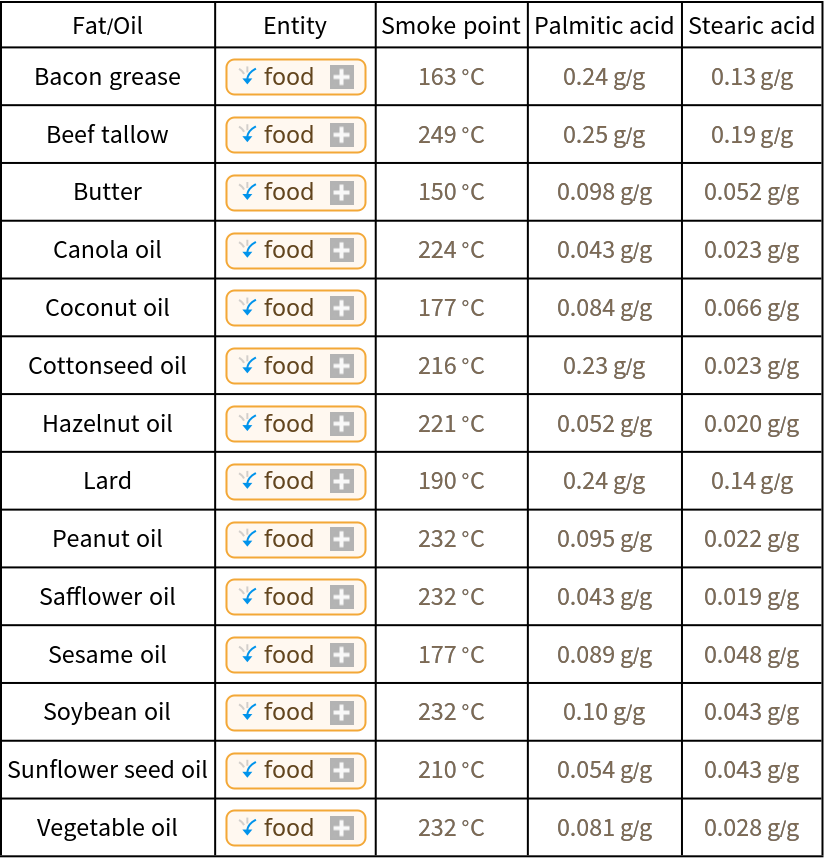
![namesEntitiesAndCelsius = Normal[ResourceData[\!\(\*
TagBox["\"\<Smoke Point\>\"",
#& ,
BoxID -> "ResourceTag-Smoke Point-Input",
AutoDelete->True]\)][[All, {1, 2, 4}]]];
entitiesAndPalmiticAcid = DeleteMissing[
AssociationThread[namesEntitiesAndCelsius[[All, 2]], EntityValue[namesEntitiesAndCelsius[[All, 2]], EntityProperty["Food", "RelativePalmiticAcidContent"]]]];
entitiesAndStearicAcid = DeleteMissing[
AssociationThread[namesEntitiesAndCelsius[[All, 2]], EntityValue[namesEntitiesAndCelsius[[All, 2]], EntityProperty["Food", "RelativeStearicAcidContent"]]]];
filteredData = Select[namesEntitiesAndCelsius, KeyExistsQ[entitiesAndPalmiticAcid, #["Entity"]] &];
combinedData = filteredData /. assoc_Association :> Append[assoc, {"RelativePalmiticAcidContent" -> entitiesAndPalmiticAcid[assoc["Entity"]], "RelativeStearicAcidContent" -> entitiesAndStearicAcid[assoc["Entity"]]}];
formattedData = {{"Fat/Oil", "Entity", "Smoke point", "Palmitic acid",
"Stearic acid"}}~
Join~({#["Oil type"], #["Entity"], #["Celsius"], #[
"RelativePalmiticAcidContent"], #[
"RelativeStearicAcidContent"]} & /@ combinedData);
Grid[formattedData, Frame -> All]](https://www.wolframcloud.com/obj/resourcesystem/images/2fa/2fa40c86-7630-460a-a7e5-94530213d1d9/0c3e3e8a6e5b1b12.png)
![oilNames = formattedData[[2 ;;, 1]];
smokePoints = QuantityMagnitude[formattedData[[2 ;;, 3]]];
palmiticAcid = QuantityMagnitude[formattedData[[2 ;;, 4]]];
stearicAcid = QuantityMagnitude[formattedData[[2 ;;, 5]]];
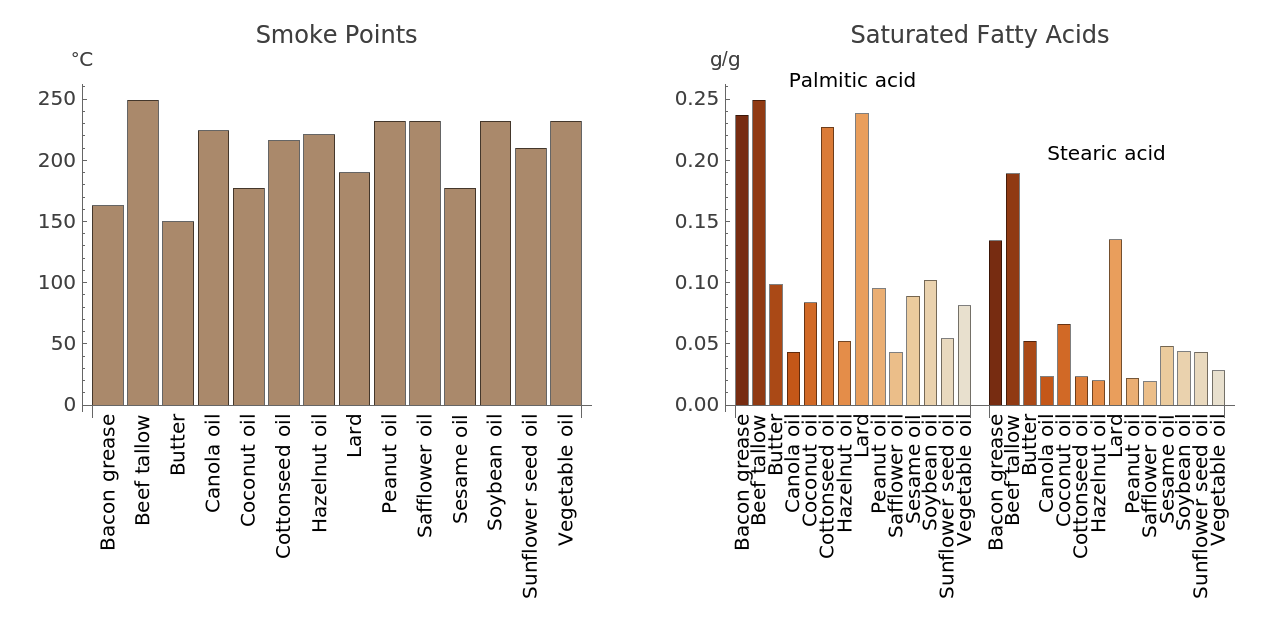
smokePointChart = BarChart[smokePoints, Sequence[
ChartLabels -> Placed[oilNames, Below, Rotate[#, Pi/2]& ], PlotLabel -> "Smoke Points", AxesLabel -> "°C", ChartStyle -> StandardBrown, ImageSize -> Medium]];
satFatData = {palmiticAcid, stearicAcid};
satFatLabels = {"Palmitic acid", "Stearic acid"};
satFatAcidsChart = BarChart[satFatData, Sequence[
ChartLayout -> "Grouped", AxesLabel -> "g/g", ChartLabels -> {
Placed[satFatLabels, Above],
Placed[oilNames, Below, Rotate[#, Pi/2]& ]}, ChartStyle -> "SiennaTones", PlotLabel -> "Saturated Fatty Acids"]];
GraphicsRow[{smokePointChart, satFatAcidsChart}]](https://www.wolframcloud.com/obj/resourcesystem/images/2fa/2fa40c86-7630-460a-a7e5-94530213d1d9/3e18e5cad1739c1e.png)