Wolfram Data Repository
Immediate Computable Access to Curated Contributed Data
U.S. Census Bureau, 2013 Annual Survey of State Government Finances
(57 columns, 51 rows)
View the data:
| In[1]:= |
| Out[1]= |
Geographic plot of state revenues:
| In[2]:= | ![GeoRegionValuePlot[
Rule @@@ ResourceData["State Government Finances 2013"][
Rest, {"Geography", "Total Revenue"}]]](https://www.wolframcloud.com/obj/resourcesystem/images/aea/aea2abb5-c61d-4f6c-9f3b-819b5a97c3c0/621a95eabac93956.png) |
| Out[2]= | 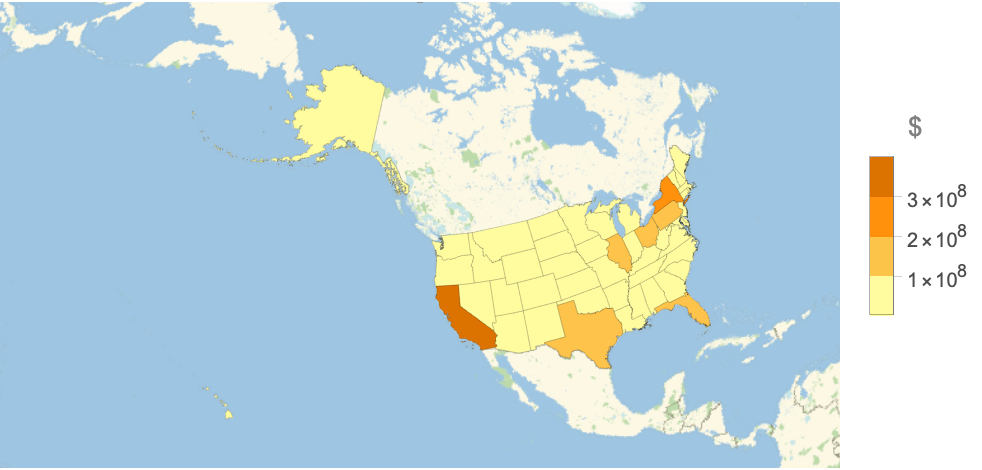 |
Compare California’s revenue to the 22 smallest states:
| In[3]:= | ![ResourceData["State Government Finances 2013"][
Select[#Geography == Entity["AdministrativeDivision", {"California", "UnitedStates"}] &], {"Total Revenue"}]](https://www.wolframcloud.com/obj/resourcesystem/images/aea/aea2abb5-c61d-4f6c-9f3b-819b5a97c3c0/0e82559950bf7f2b.png) |
| Out[3]= | 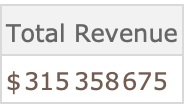 |
| In[4]:= |
| Out[4]= |
Wolfram Research, "State Government Finances 2013" from the Wolfram Data Repository (2016) https://doi.org/10.24097/wolfram.78046.data