Wolfram Data Repository
Immediate Computable Access to Curated Contributed Data
Average annual and monthly number of days with thunder
This dataset contains information on the average annual and monthly number of days with thunder for 794 weather stations throughout 38 countries. Data from a vast majority of the stations comes from the latest global standard normals period, 1961-1990. For each weather station, the station's name, ID, and geolocation are available.
Retrieve the ResourceObject:
| In[1]:= |
| Out[1]= |  |
View the data:
| In[2]:= |
| Out[2]= | 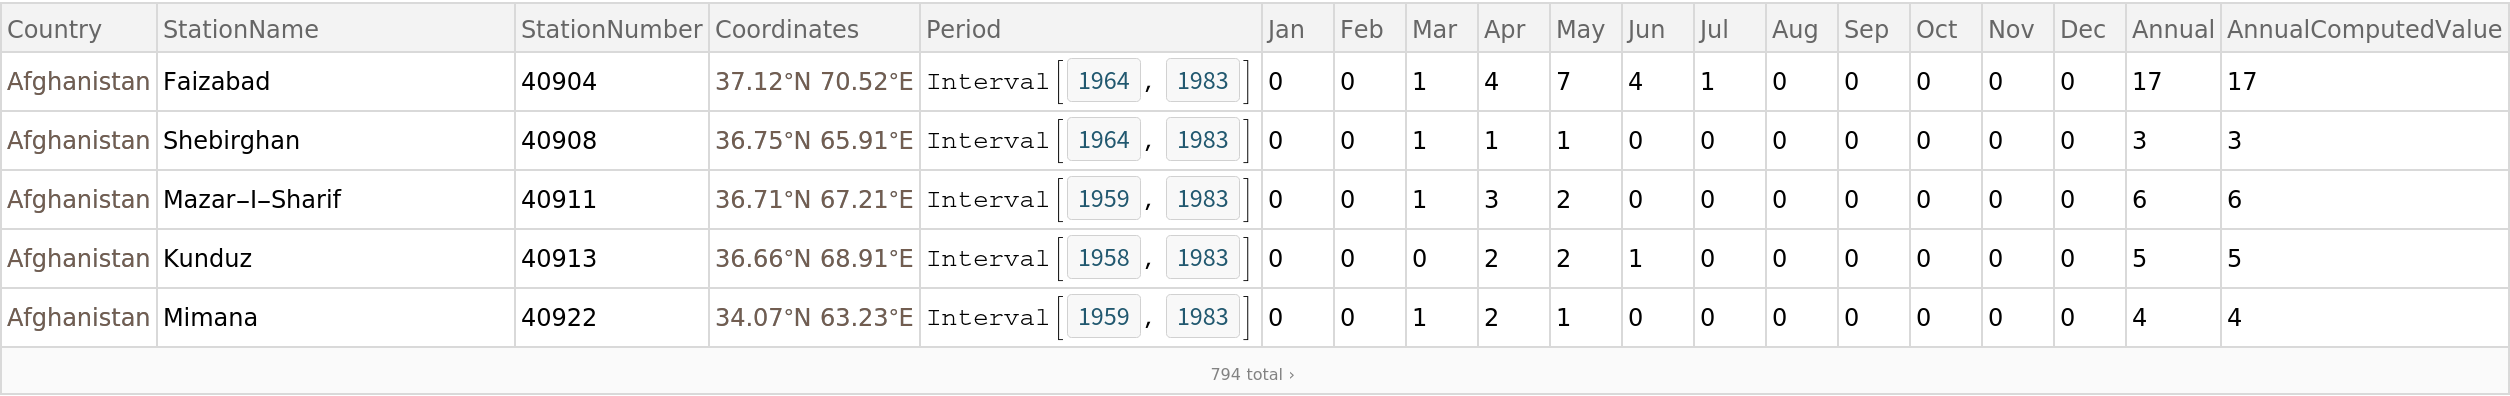 |
Show which months had the highest thunder frequency at a WMO station in Afghanistan:
| In[3]:= |
| Out[3]= | 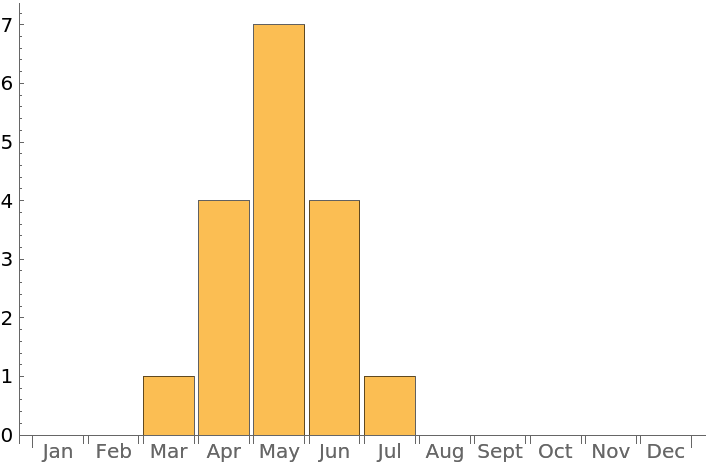 |
Show total thunder frequency across all WMO reporting stations by month:
| In[4]:= | ![BarChart[
Total /@ DeleteMissing /@ Transpose[
ResourceData["Thunder Frequency by WMO Station"][[All, 6 ;; 17]]],
ChartLabels -> Automatic]](https://www.wolframcloud.com/obj/resourcesystem/images/d58/d58f06d0-ee3e-48cf-a447-dcf8161eaff7/15bc3a9593b7f91f.png) |
| Out[4]= | 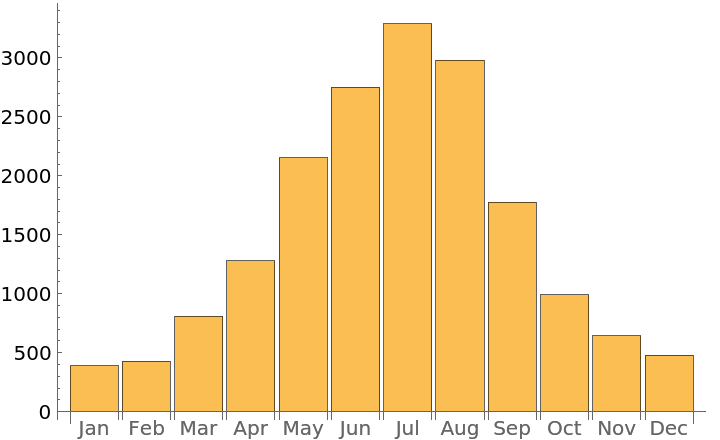 |
Show annual thunder frequency at each WMO station location in Afghanistan:
| In[5]:= | ![GeoBubbleChart[
Rule @@@ ResourceData["Thunder Frequency by WMO Station"][
Select[#Country == Entity["Country", "Afghanistan"] &]][
All, {"Coordinates", "Annual"}], ImageSize -> 400, ColorFunction -> "Rainbow"]](https://www.wolframcloud.com/obj/resourcesystem/images/d58/d58f06d0-ee3e-48cf-a447-dcf8161eaff7/244c0eed8bec7575.png) |
| Out[5]= | 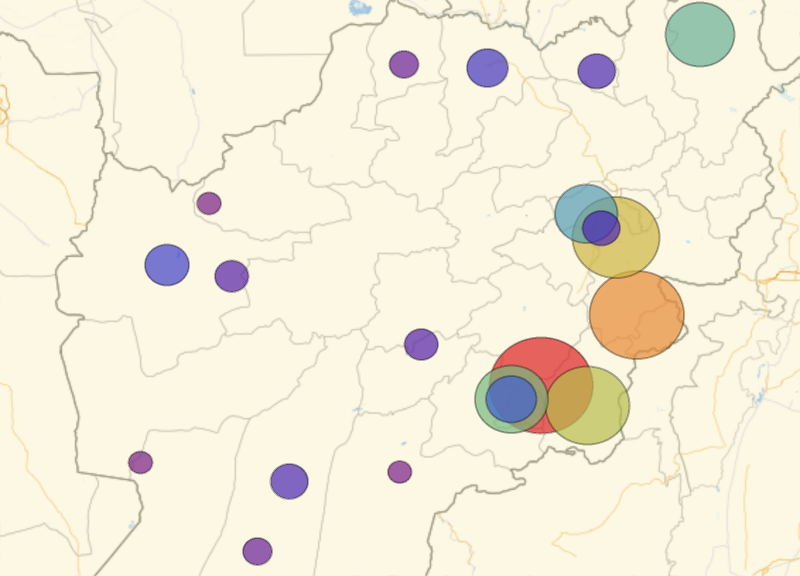 |
Wolfram Research, "Thunder Frequency by WMO Station" from the Wolfram Data Repository (2018) https://doi.org/10.24097/wolfram.15108.data
Public Domain