Wolfram Data Repository
Immediate Computable Access to Curated Contributed Data
An estimate of exposure to disease (generally) and physical proximity for UK occupations based on US analysis of these factors, using 2019 data
Explore the data:
| In[1]:= | ![ResourceData[
ResourceObject[
"UK Occupation Estimates: Exposure to Generic Disease and Physical \
Proximity"]][[1]]](https://www.wolframcloud.com/obj/resourcesystem/images/352/3521a4b9-eef2-46e5-ad37-b366f430cc83/2306aeacf2325ea6.png) |
| Out[1]= | 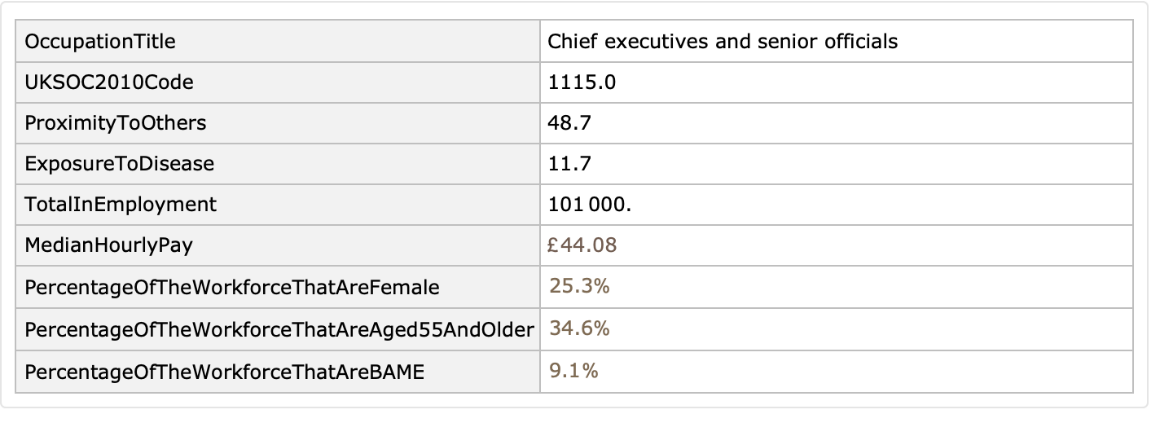 |
(The BAME group includes: Mixed/Multiple ethnic groups; Indian; Pakistani; Bangladeshi; Chinese; any other Asian background; Black/African/Caribbean/Black British)
Plot generic disease exposure risk versus physical proximity :
| In[2]:= | ![BubbleChart[
Tooltip[{#1, #2, #3}, #4] & @@@ Select[{#ProximityToOthers, #ExposureToDisease, #TotalInEmployment, \
#OccupationTitle} & /@ ResourceData[
ResourceObject[
"UK Occupation Estimates: Exposure to Generic Disease and \
Physical Proximity"]], FreeQ[#, _Missing] &], ChartElementFunction -> "NoiseBubble", FrameLabel -> {"physical proximity", "exposure risk"}]](https://www.wolframcloud.com/obj/resourcesystem/images/352/3521a4b9-eef2-46e5-ad37-b366f430cc83/61efe485c415976a.png) |
| Out[2]= | 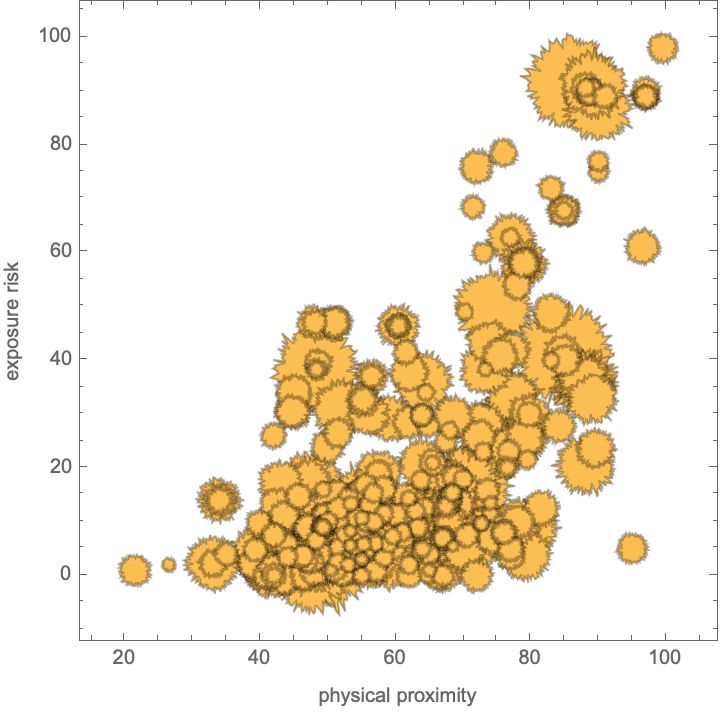 |
Plot generic disease exposure risk versus median hourly pay :
| In[3]:= | ![BubbleChart[
Tooltip[{#1, #2, #3}, #4] & @@@ Select[{#MedianHourlyPay, #ExposureToDisease, #TotalInEmployment, \
#OccupationTitle} & /@ ResourceData[
ResourceObject[
"UK Occupation Estimates: Exposure to Generic Disease and \
Physical Proximity"]], FreeQ[#, _Missing] &], ChartElementFunction -> "NoiseBubble", FrameLabel -> {"median hourly pay", "exposure risk"}]](https://www.wolframcloud.com/obj/resourcesystem/images/352/3521a4b9-eef2-46e5-ad37-b366f430cc83/405e806e08d2d524.png) |
| Out[3]= | 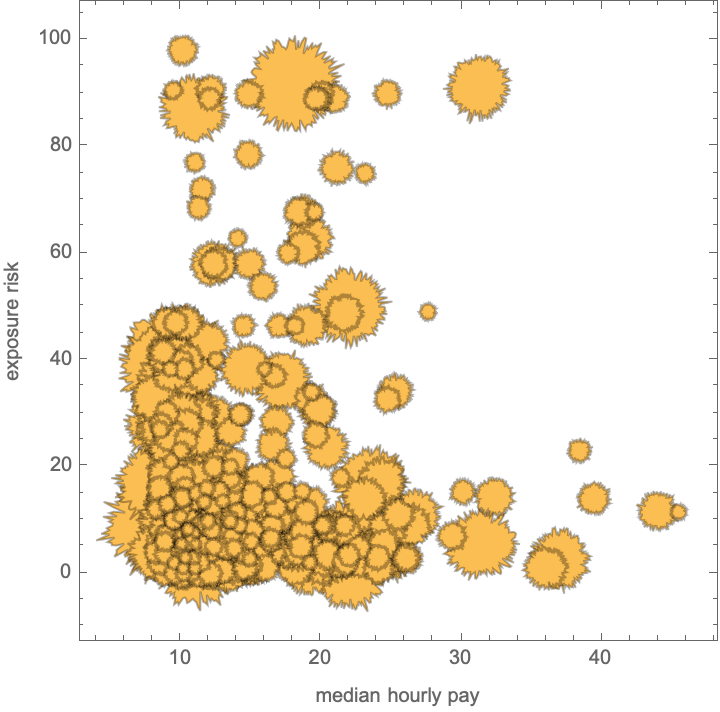 |
Show occupation metrics after ranking by exposure risk to disease:
| In[4]:= | ![ReverseSort[{#ExposureToDisease, \
#PercentageOfTheWorkforceThatAreFemale, \
#PercentageOfTheWorkforceThatAreAged55AndOlder, \
#PercentageOfTheWorkforceThatAreBAME, #MedianHourlyPay, \
#TotalInEmployment, #OccupationTitle} & /@ ResourceData[
ResourceObject[
"UK Occupation Estimates: Exposure to Generic Disease and Physical \
Proximity"]]]](https://www.wolframcloud.com/obj/resourcesystem/images/352/3521a4b9-eef2-46e5-ad37-b366f430cc83/501eb936a6cf71d2.png) |
| Out[4]= | 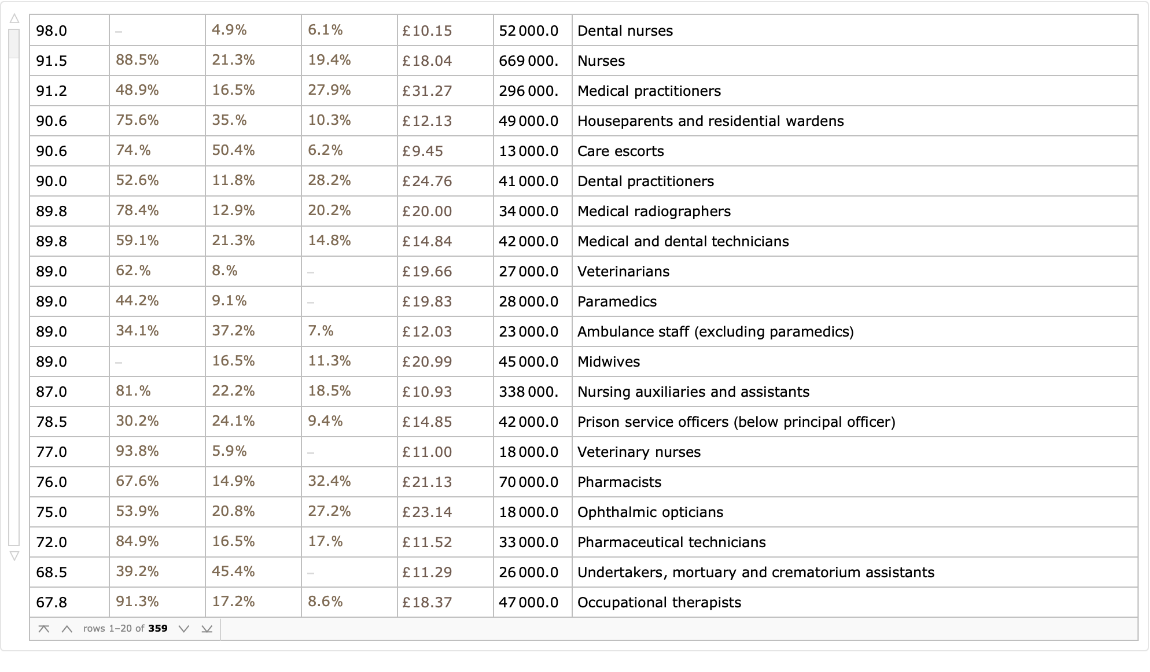 |
Wolfram Research, "UK Occupation Estimates: Exposure to Generic Disease and Physical Proximity" from the Wolfram Data Repository (2020)