Details
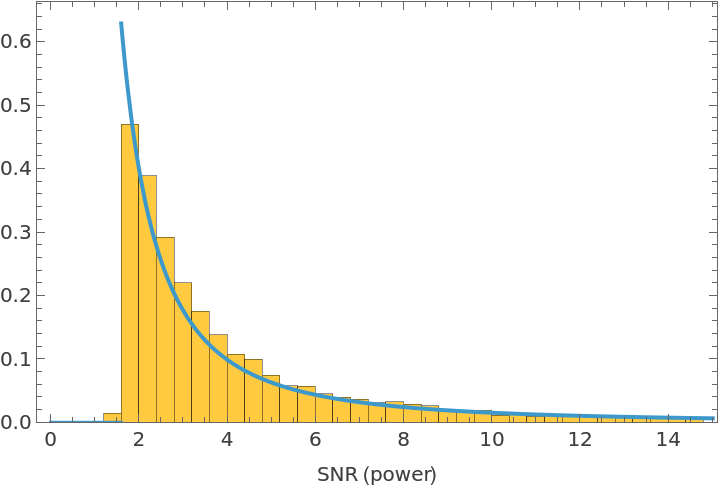
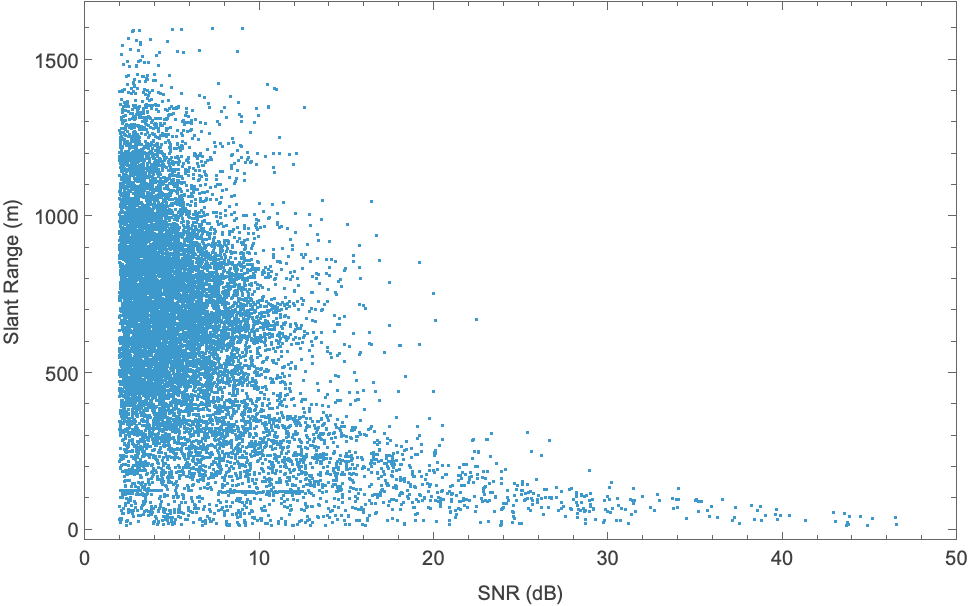
The data presented here were recorded by a ground-based, 33.4 GHz radar operated at Yuma AZ in the spring of 2017. The data are of the form echo signal-to-noise (SNR) and corresponding echo range in meters. All echoes above a 2 dB threshold in the recording interval are presented. The measured echo SNR values are found to be well fitted by a Pareto distribution.
By detected signal to noise ratio (SNR) reference is made to radar echoes that are above a threshold that is large enough to insure that the echo is produced by reflection from a target and is not just a spike in the background noise level.
The
SNR of a radar echo can be written in the simplified form
y=F/ra where the symbol
y denotes the
SNR of the echo measured on a power scale,
F is the figure of merit of the radar,
r is the radial distance (or slant range) to the target and
a is the decay rate constant. The cases
a=1,2 and 4 respectively refer to the passive detection of an advancing cylindrical wave, the weather radar equation and the ordinary radar equation. If
yT denotes the threshold SNR for the radar, then the maximum range at which the radar can make a detection is
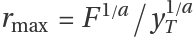
.
If
β denotes the constant density per unit volume of targets, then the number of detections produced by the radar at the two SNR thresholds
yT and
y>yT is
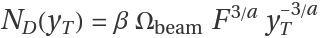
and
ND(y)=β ΩbeamF3/ay-3/a. If the radar is omnidirectional and the entire hemisphere is illuminated then
Ωbeam=2π. The fraction of targets that are detected at
SNR values
y>yT is the ratio of these two quantities, i.e.
(yT/y)3/a. The cumulative fraction of targets detected as a function of the
SNR value
y is
G(y)=1-(yT/y)3/a for
y≥yT and zero otherwise. This is the cummulative probability density function of a Pareto distribution with decay parameter
α=3/a and threshold parameter
yT.
The range dependence in the underlying radar equation that governs the propagation physics is encoded in the parameter α=3/a. The median value of a Pareto distribution with threshold yT and decay constant α is 21/αyT. This implies that 1/2 of all detections will occur in the SNR range yT≤y≤21/αyT. For the case α=3/2 (weather radar equation with a=2), 1/2 of detections occur within 10log1022/3=2 dB of the threshold yT.
![data = Keys[ResourceData[\!\(\*
TagBox["\"\<Universal Probability Density Function of Detected SNR\>\"",
#& ,
BoxID -> "ResourceTag-Universal Probability Density Function of Detected SNR-Input",
AutoDelete->True]\)]];
data = 10^(data/10);
estdist = EstimatedDistribution[data, ParetoDistribution[k, \[Alpha]]];
g1 = Histogram[data, {0, 15, 0.4}, Sequence[
"PDF", Axes -> False, Frame -> True, FrameLabel -> {"SNR (power)"},
PlotRange -> All]];
g2 = Plot[PDF[estdist, y], {y, 0, 15}, Sequence[
Axes -> False, Frame -> True, FrameLabel -> {"SNR (power)"}, PlotRange -> All]];
Show[g1, g2]](https://www.wolframcloud.com/obj/resourcesystem/images/7a3/7a334e31-b67a-448a-a45e-8731ebd40ada/6d33546645eb1df6.png)