Wolfram Data Repository
Immediate Computable Access to Curated Contributed Data
Western Europe 650 year Grape Harvest Data from 1354 to 2007
An open-access dataset of grape harvest dates (GHD) series that has been compiled from international, French and Spanish literature and from unpublished documentary sources from public organizations and from wine-growers. As of June 2011, this GHD dataset comprises 380 series mainly from France (93% of the data) as well as series from Switzerland, Italy, Spain and Luxemburg. The series have variable length (from 1 to 479 data, mean length of 45 data) and contain gaps of variable sizes (mean ratio of observations/series length of 0.74). The longest and most complete ones are from Burgundy, Switzerland, Southern Rhône valley, Jura and Ile-de-France. The most ancient harvest date of the dataset is in 1354 in Burgundy. The GHD series were grouped into 27 regions according to their location, to geomorphological and geological criteria, and to past and present grape varieties. The GHD regional composite series (GHD-RCS) were calculated and compared pairwise to assess their reliability assuming that series close to one another are highly correlated. Most of the pairwise correlations are significant (p-value <0.001) and strong (mean pairwise correlation coefficient of 0.58). As expected, the correlations tend to be higher when the vineyards are closer. The highest correlation (R = 0.91) is obtained between the High Loire Valley and the Ile-de-France GHD-RCS. The strong dependence of the vine cycle on temperature and, therefore, the strong link between the harvest dates and the temperature of the growing season was also used to test the quality of the GHD series. The strongest correlations are obtained between the GHD-RCS and the temperature series of the nearest weather stations. Moreover, the GHD-RCS/ temperature correlation maps show spatial patterns similar to temperature correlation maps. The stability of the correlations over time is explored. The most striking feature is their generalized deterioration at the late 19th - early 20th turning point. The possible effects on GHD of the phylloxera crisis, which took place at this time, are discussed. The median of all the standardized GHD-RCS was calculated. The distribution of the extreme years of this general series is not homogenous. Extremely late years all occur during a two-century long time window from the early 17th to the early 19th century, while extremely early years are frequent during the 16th and since the mid-19th century. The dataset is made accessible for climate research from (http://www.gdr2968.cnrs.fr/spip.php?rubrique29/) and from the World Data Center for Paleoclimatology (http://www.ncdc.noaa.gov/paleo/paleo.html).
(3 columns, 27 rows)
Retrieve the default content:
| In[1]:= |
| Out[1]= | 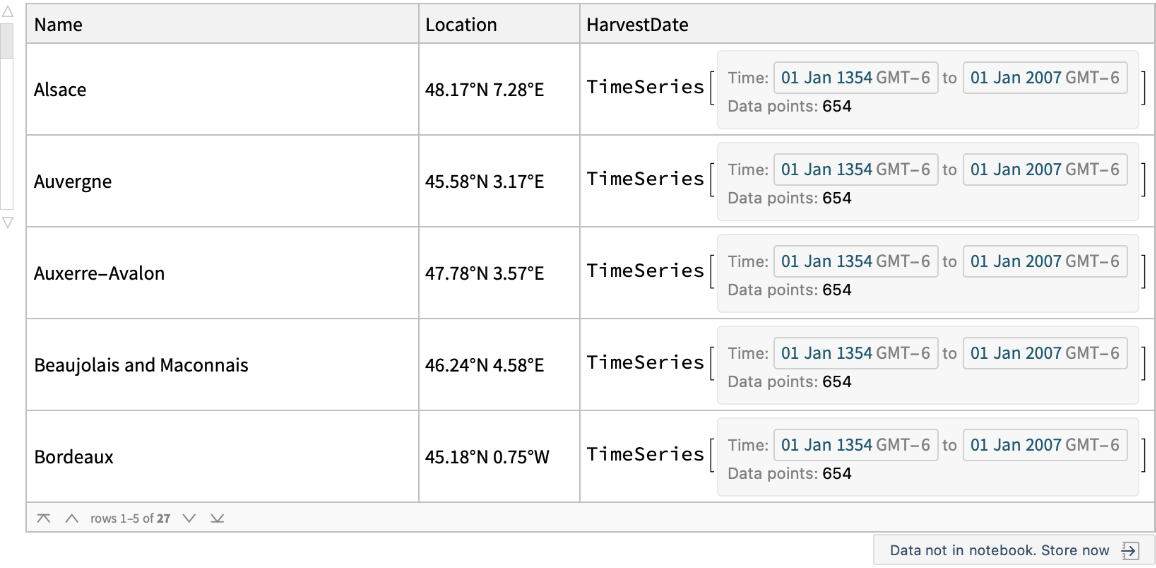 |
Draw a map of the locations being tracked:
| In[2]:= |
| Out[2]= | 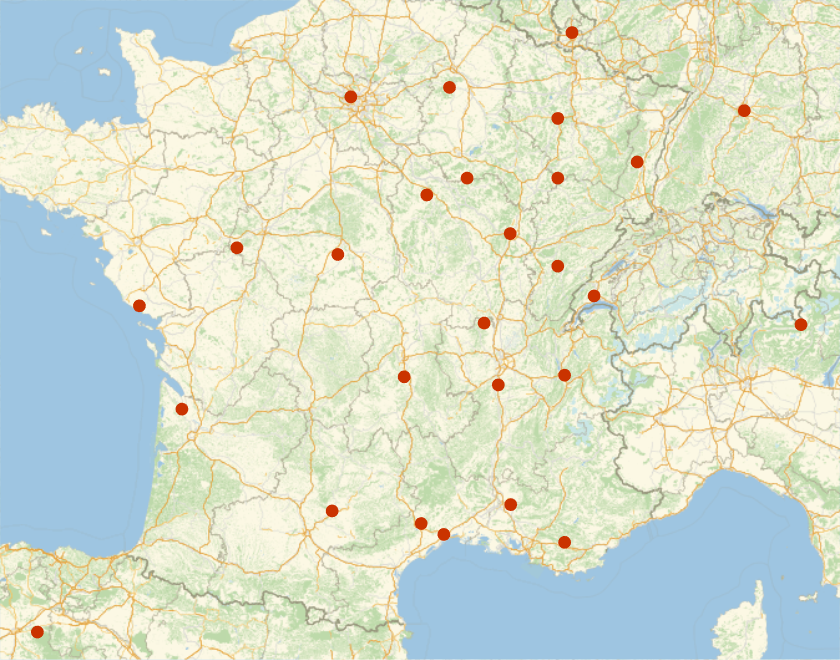 |
Compare harvest dates over time for two regions:
| In[3]:= | ![With[{data = Select[ResourceData["Western Europe Grape Harvest"], StringContainsQ[#Name, "Germany" | "Southern Rhone valley"] &]},
DateListPlot[data[All, "HarvestDate"], PlotLegends -> Normal@data[All, "Name"]]
]](https://www.wolframcloud.com/obj/resourcesystem/images/c90/c908f4bf-0707-45d4-8bb8-4dd3a8621938/6af2dafa0a714eac.png) |
| Out[3]= | 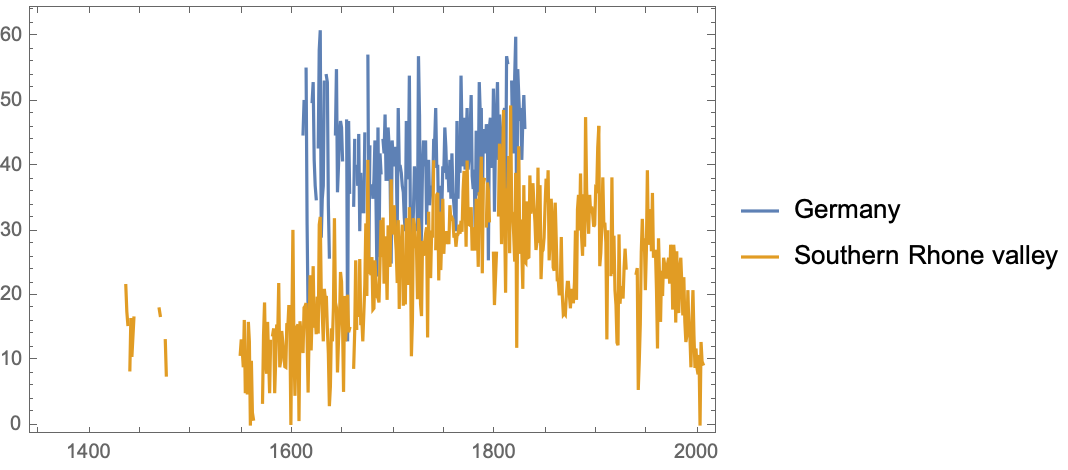 |
Wolfram Research, "Western Europe Grape Harvest" from the Wolfram Data Repository (2017) https://doi.org/10.24097/wolfram.48232.data
This work is distributed under the Creative Commons Attribution 3.0 License.