Wolfram Data Repository
Immediate Computable Access to Curated Contributed Data
Mobility Reports from Google for the USA
| In[1]:= | ![la = ResourceData[\!\(\*
TagBox["\"\<USA Google Mobility Data\>\"",
#& ,
BoxID -> "ResourceTag-USA Google Mobility Data-Input",
AutoDelete->True]\)][
SelectFirst[#County == Entity["AdministrativeDivision", {"LosAngelesCounty", "California", "UnitedStates"}] &]];](https://www.wolframcloud.com/obj/resourcesystem/images/670/670e5993-2d0b-4a5b-a528-5395fc179eeb/02b1d07b822496ac.png) |
| In[2]:= | ![Multicolumn[
KeyValueMap[
DateListPlot[{#2, TimeSeriesResample[#2, "Weekend"]}, PlotLabel -> #1, Sequence[
Joined -> {True, False}, Filling -> {1 -> Axis, 2 -> {Axis,
Directive[
Opacity[0.2], Red, Thick]}}, AspectRatio -> 1/2, FrameTicks -> {{{{-80, "-80%"}, {-40, "-40%"}, {0, "Baseline"}, {40, "+40%"}, {80, "+80%"}}, None}, { DateRange["Feb 29, 2020", "June 16, 2020",
Quantity[2, "Weeks"]], None}}, ImageSize -> Medium, PlotRange -> {{"Feb 29, 2020", "June 16, 2020"}, {-80, 80}}, GridLines -> {None, {-80, -40, 0, 40, 80}}, PlotStyle -> {Automatic, None}]] &][Normal[la[4 ;;]]], 2]](https://www.wolframcloud.com/obj/resourcesystem/images/670/670e5993-2d0b-4a5b-a528-5395fc179eeb/5d44fcb9701d3f65.png) |
| Out[2]= |  |
It seems that Americans sneak out to workplace on weekends! Note that the red lines in the following visualizations highlight weekends:
Visualize mobility data of US states:| In[3]:= | ![ResourceData[\!\(\*
TagBox["\"\<USA Google Mobility Data\>\"",
#& ,
BoxID -> "ResourceTag-USA Google Mobility Data-Input",
AutoDelete->True]\)][
Select[#Country == Entity["Country", "UnitedStates"] && #County ==
Missing["NotAvailable"] &]][2 ;; -1, DateListPlot[{#Workplaces, TimeSeriesResample[#Workplaces, "Weekend"]}, PlotLabel -> #State["StateAbbreviation"], Sequence[
Joined -> {True, False}, Filling -> {1 -> Axis, 2 -> {Axis,
Directive[
Opacity[0.3], Red, Thick]}}, AspectRatio -> 1/4, FrameTicks -> None, Axes -> {True, None}, ImageSize -> 200, PlotRange -> {{"Feb 29, 2020", "June 16, 2020"}, {-80, 80}}, PlotStyle -> {Automatic, None}]] &] // Normal // Multicolumn[#, 3] &](https://www.wolframcloud.com/obj/resourcesystem/images/670/670e5993-2d0b-4a5b-a528-5395fc179eeb/4d6085421d19d977.png) |
| Out[6]= | 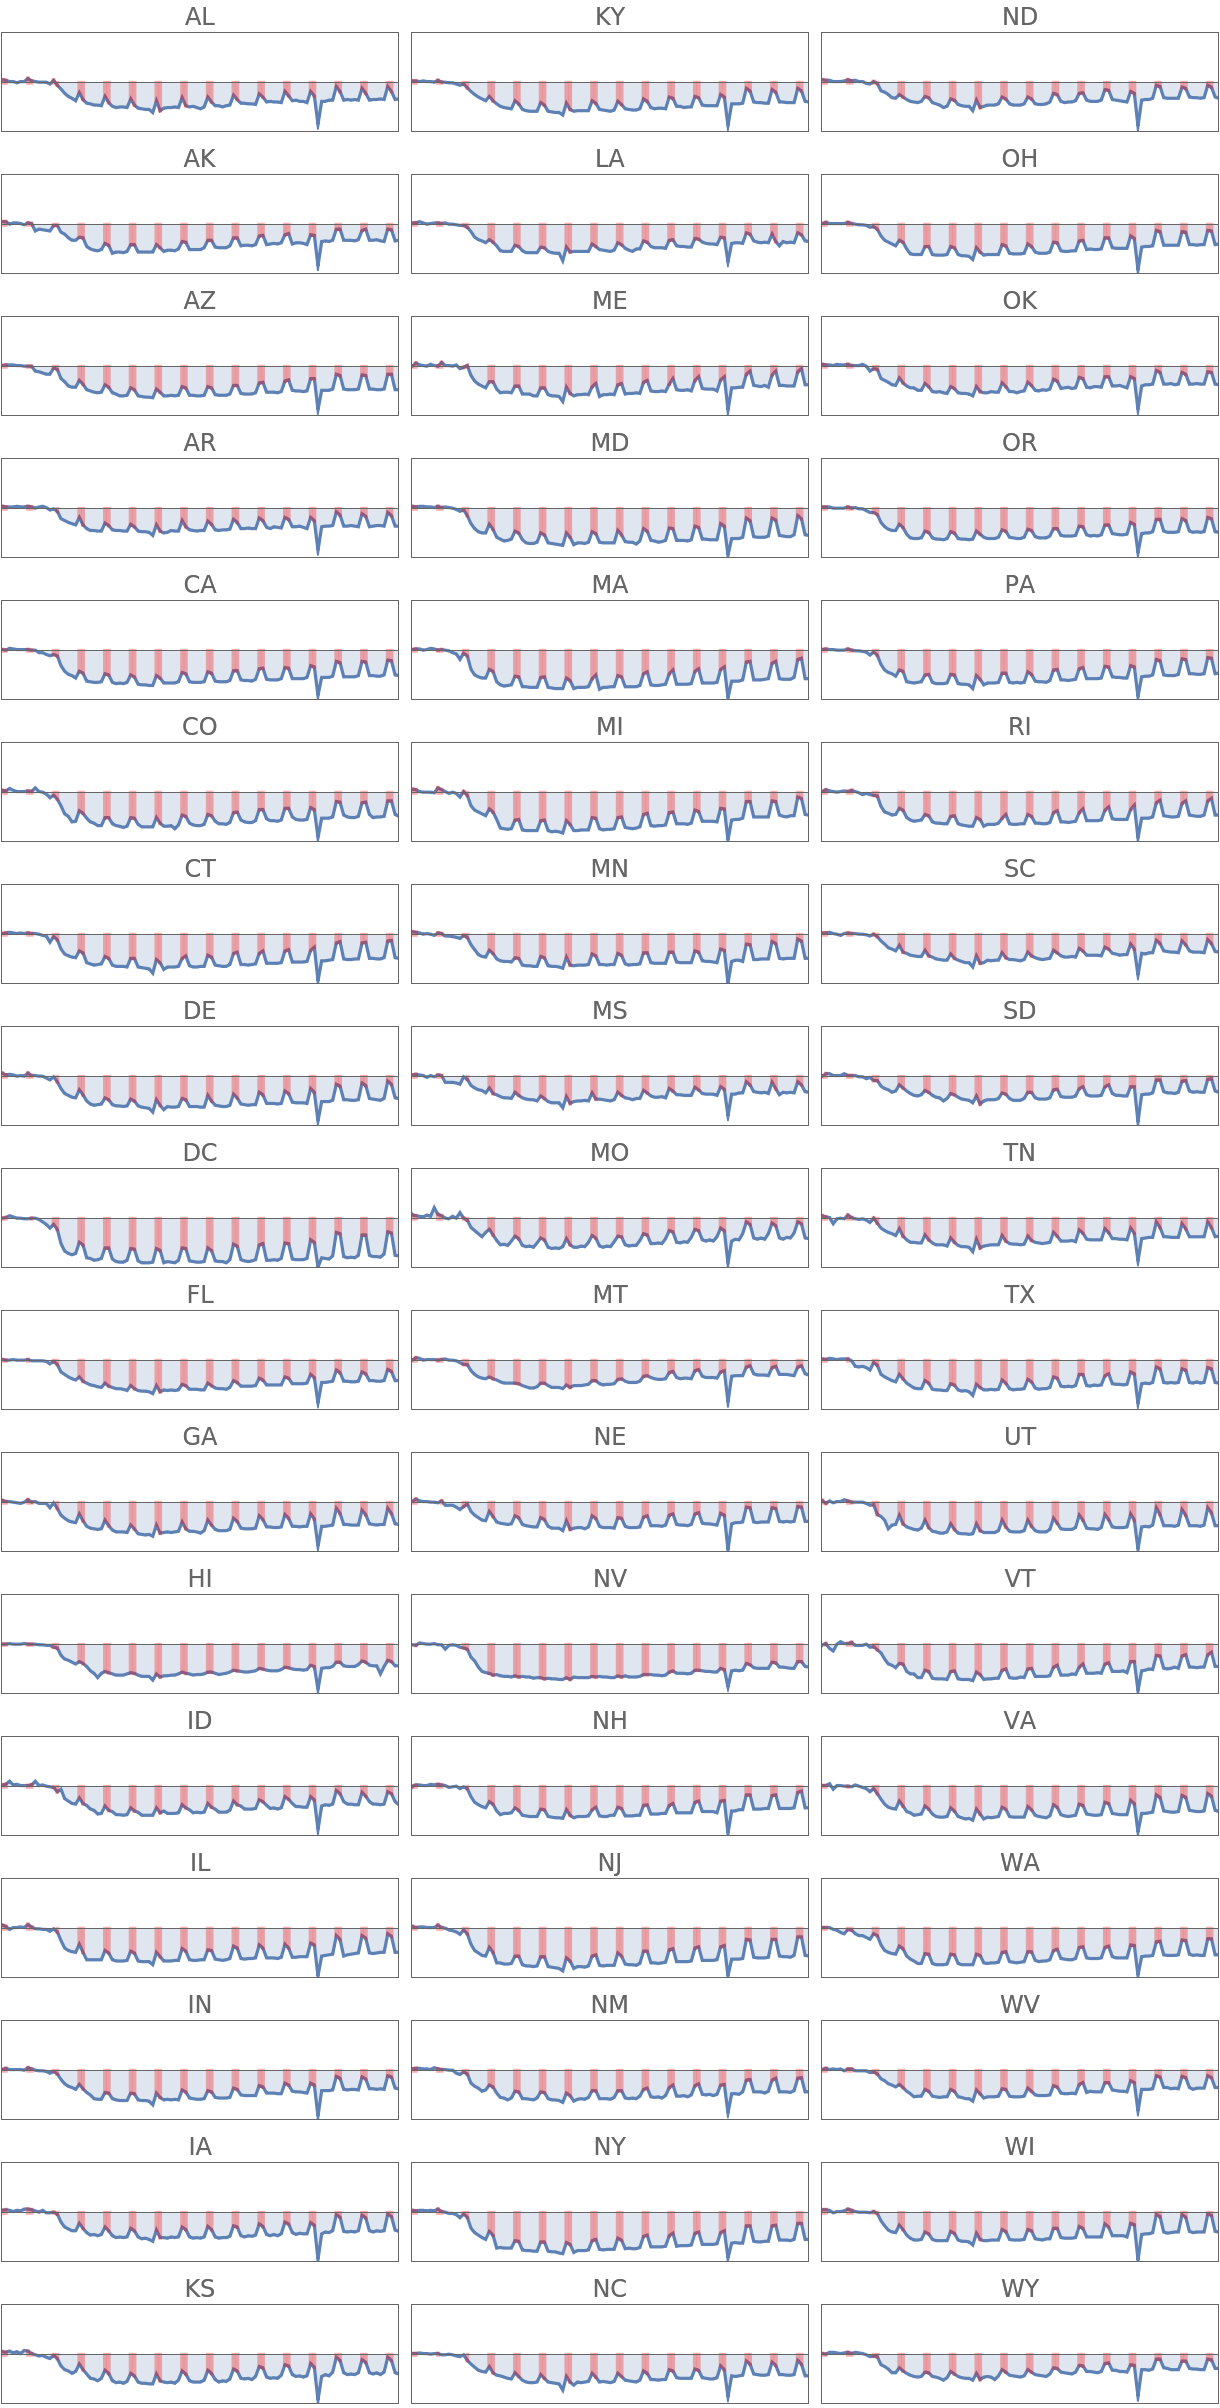 |
Wolfram Summer Camp, "USA Google Mobility Data" from the Wolfram Data Repository (2022)
Public