Details
This dataset contains greenhouse gas emissions data for the production and processing of more than 500 foods.
To capture all greenhouse gas emissions, researchers express the measured results as carbon dioxide equivalents (CO₂e). In addition to carbon dioxide (CO₂), greenhouse gases included in CO₂e results are methane, nitrous oxide, hydrofluorocarbons, perfluorocarbons, sulphur hexafluoride and nitrogen trifluoride.
CO₂e are calculated by multiplying the amount of a greenhouse gas by its global warming potential (GWP) relative to CO₂. GWP is a measure of how much heat a greenhouse gas traps in the atmosphere over a specific time period, usually 100 years, compared to CO₂.
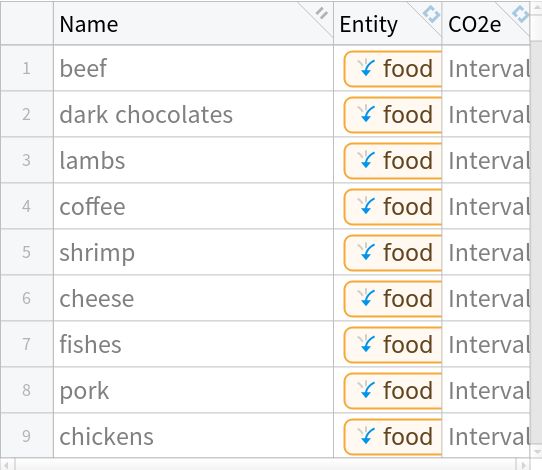
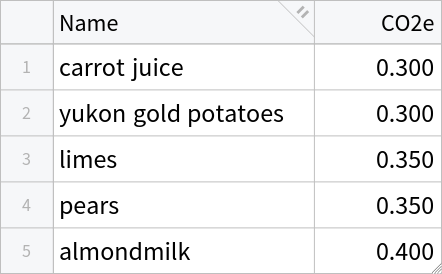
Each row in the data has three columns: food common name, food entity in Wolfram Language, and CO₂e per kilogram of that food. The data has been compiled from multiple reliable sources, which is why an interval range of CO₂e is given for each food, rather than a single value.
![data = ResourceData[\!\(\*
TagBox["\"\<Food Carbon Footprint\>\"",
#& ,
BoxID -> "ResourceTag-Food Carbon Footprint-Input",
AutoDelete->True]\)];
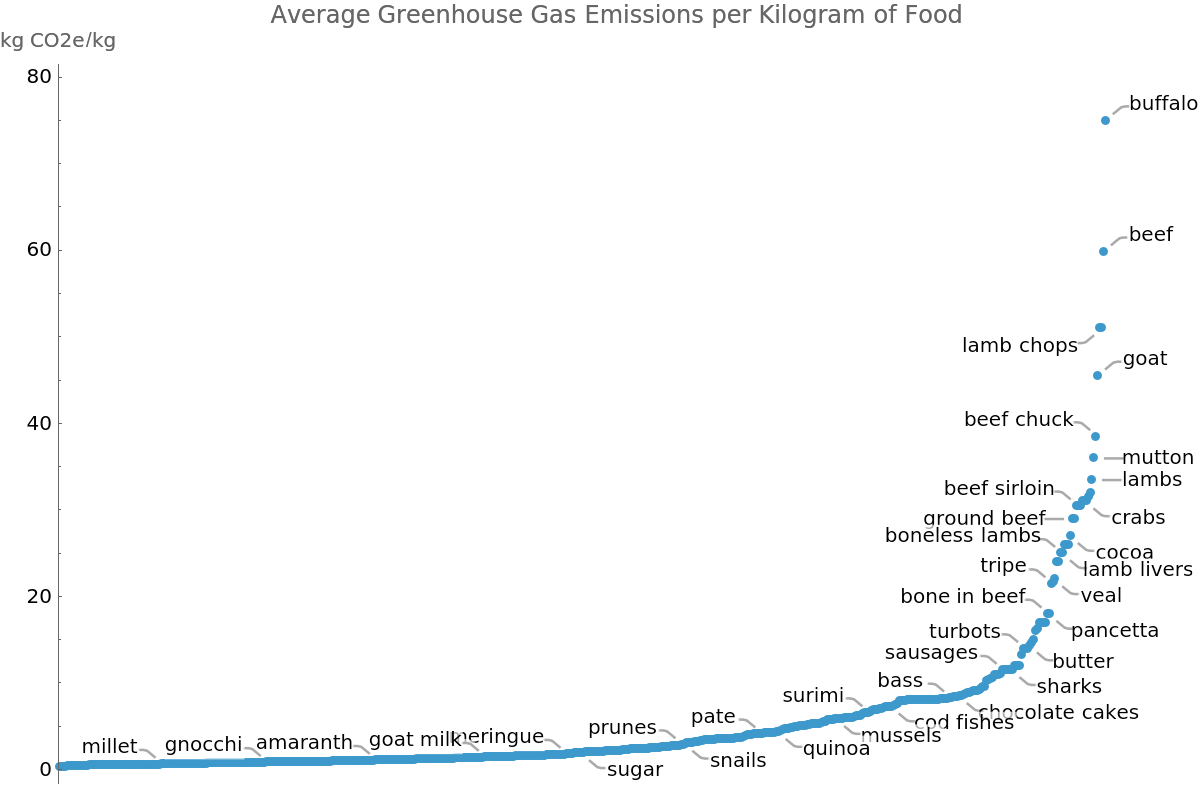
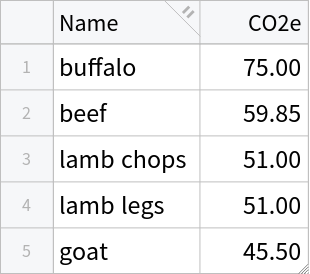
transformedData = DeleteColumns[
TransformColumns[data, "CO2e" -> (N@Mean@First[#CO2e] &)], "Entity"];
sortedData = SortBy[transformedData, "CO2e"];](https://www.wolframcloud.com/obj/resourcesystem/images/a88/a885628f-c741-4265-b5e5-774d283cbb76/109e19960be8dfcb.png)
![data = ResourceData[\!\(\*
TagBox["\"\<Food Carbon Footprint\>\"",
#& ,
BoxID -> "ResourceTag-Food Carbon Footprint-Input",
AutoDelete->True]\)];
transformedData = DeleteColumns[
TransformColumns[data, "CO2e" -> (N@Mean@First[#CO2e] &)], "Entity"];
sortedData = SortBy[transformedData, "CO2e"];
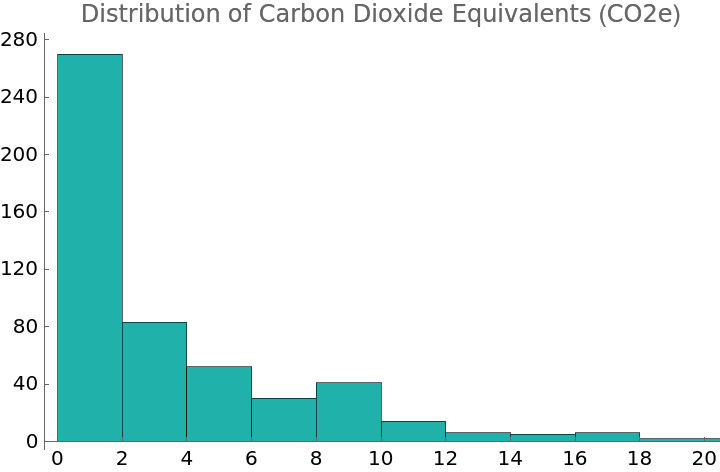
Histogram[sortedData -> "CO2e", Sequence[
PlotLabel -> "Distribution of Carbon Dioxide Equivalents (CO2e)", Ticks -> {
Range[0, 20, 2],
Range[0, 280, 40]}, ChartStyle -> ColorData["HTML", "LightSeaGreen"]]]](https://www.wolframcloud.com/obj/resourcesystem/images/a88/a885628f-c741-4265-b5e5-774d283cbb76/718922aa2361e311.png)